

Note: this post is for free subscribers and is intended to give an insight into my work at Topdown Charts (+deliver some useful and timely takeaways).
Global ex-US Equities
I wanted to share this topic from a recent Weekly Macro Themes report because it answers a few key questions, raises a couple more, and helps put into context today’s Fed rate hike decision.
Firstly, on that note, in case you missed it, the US Federal Reserve just hiked rates +25bps to 4% — as I noted last week, this is exactly what they should be doing, and we probably will see more hikes (my indicators say another ~100bps are required).
Now back to the issue at hand…
First up is the Main Page for this topic —all topics in my weekly report take this format: an overall assessment (summing up the outlook), risks against the view, catalysts to reinforce the view, a key chart to provide big picture visibility on what is happening, and ratings for each of the core factors I look at (table at the bottom).
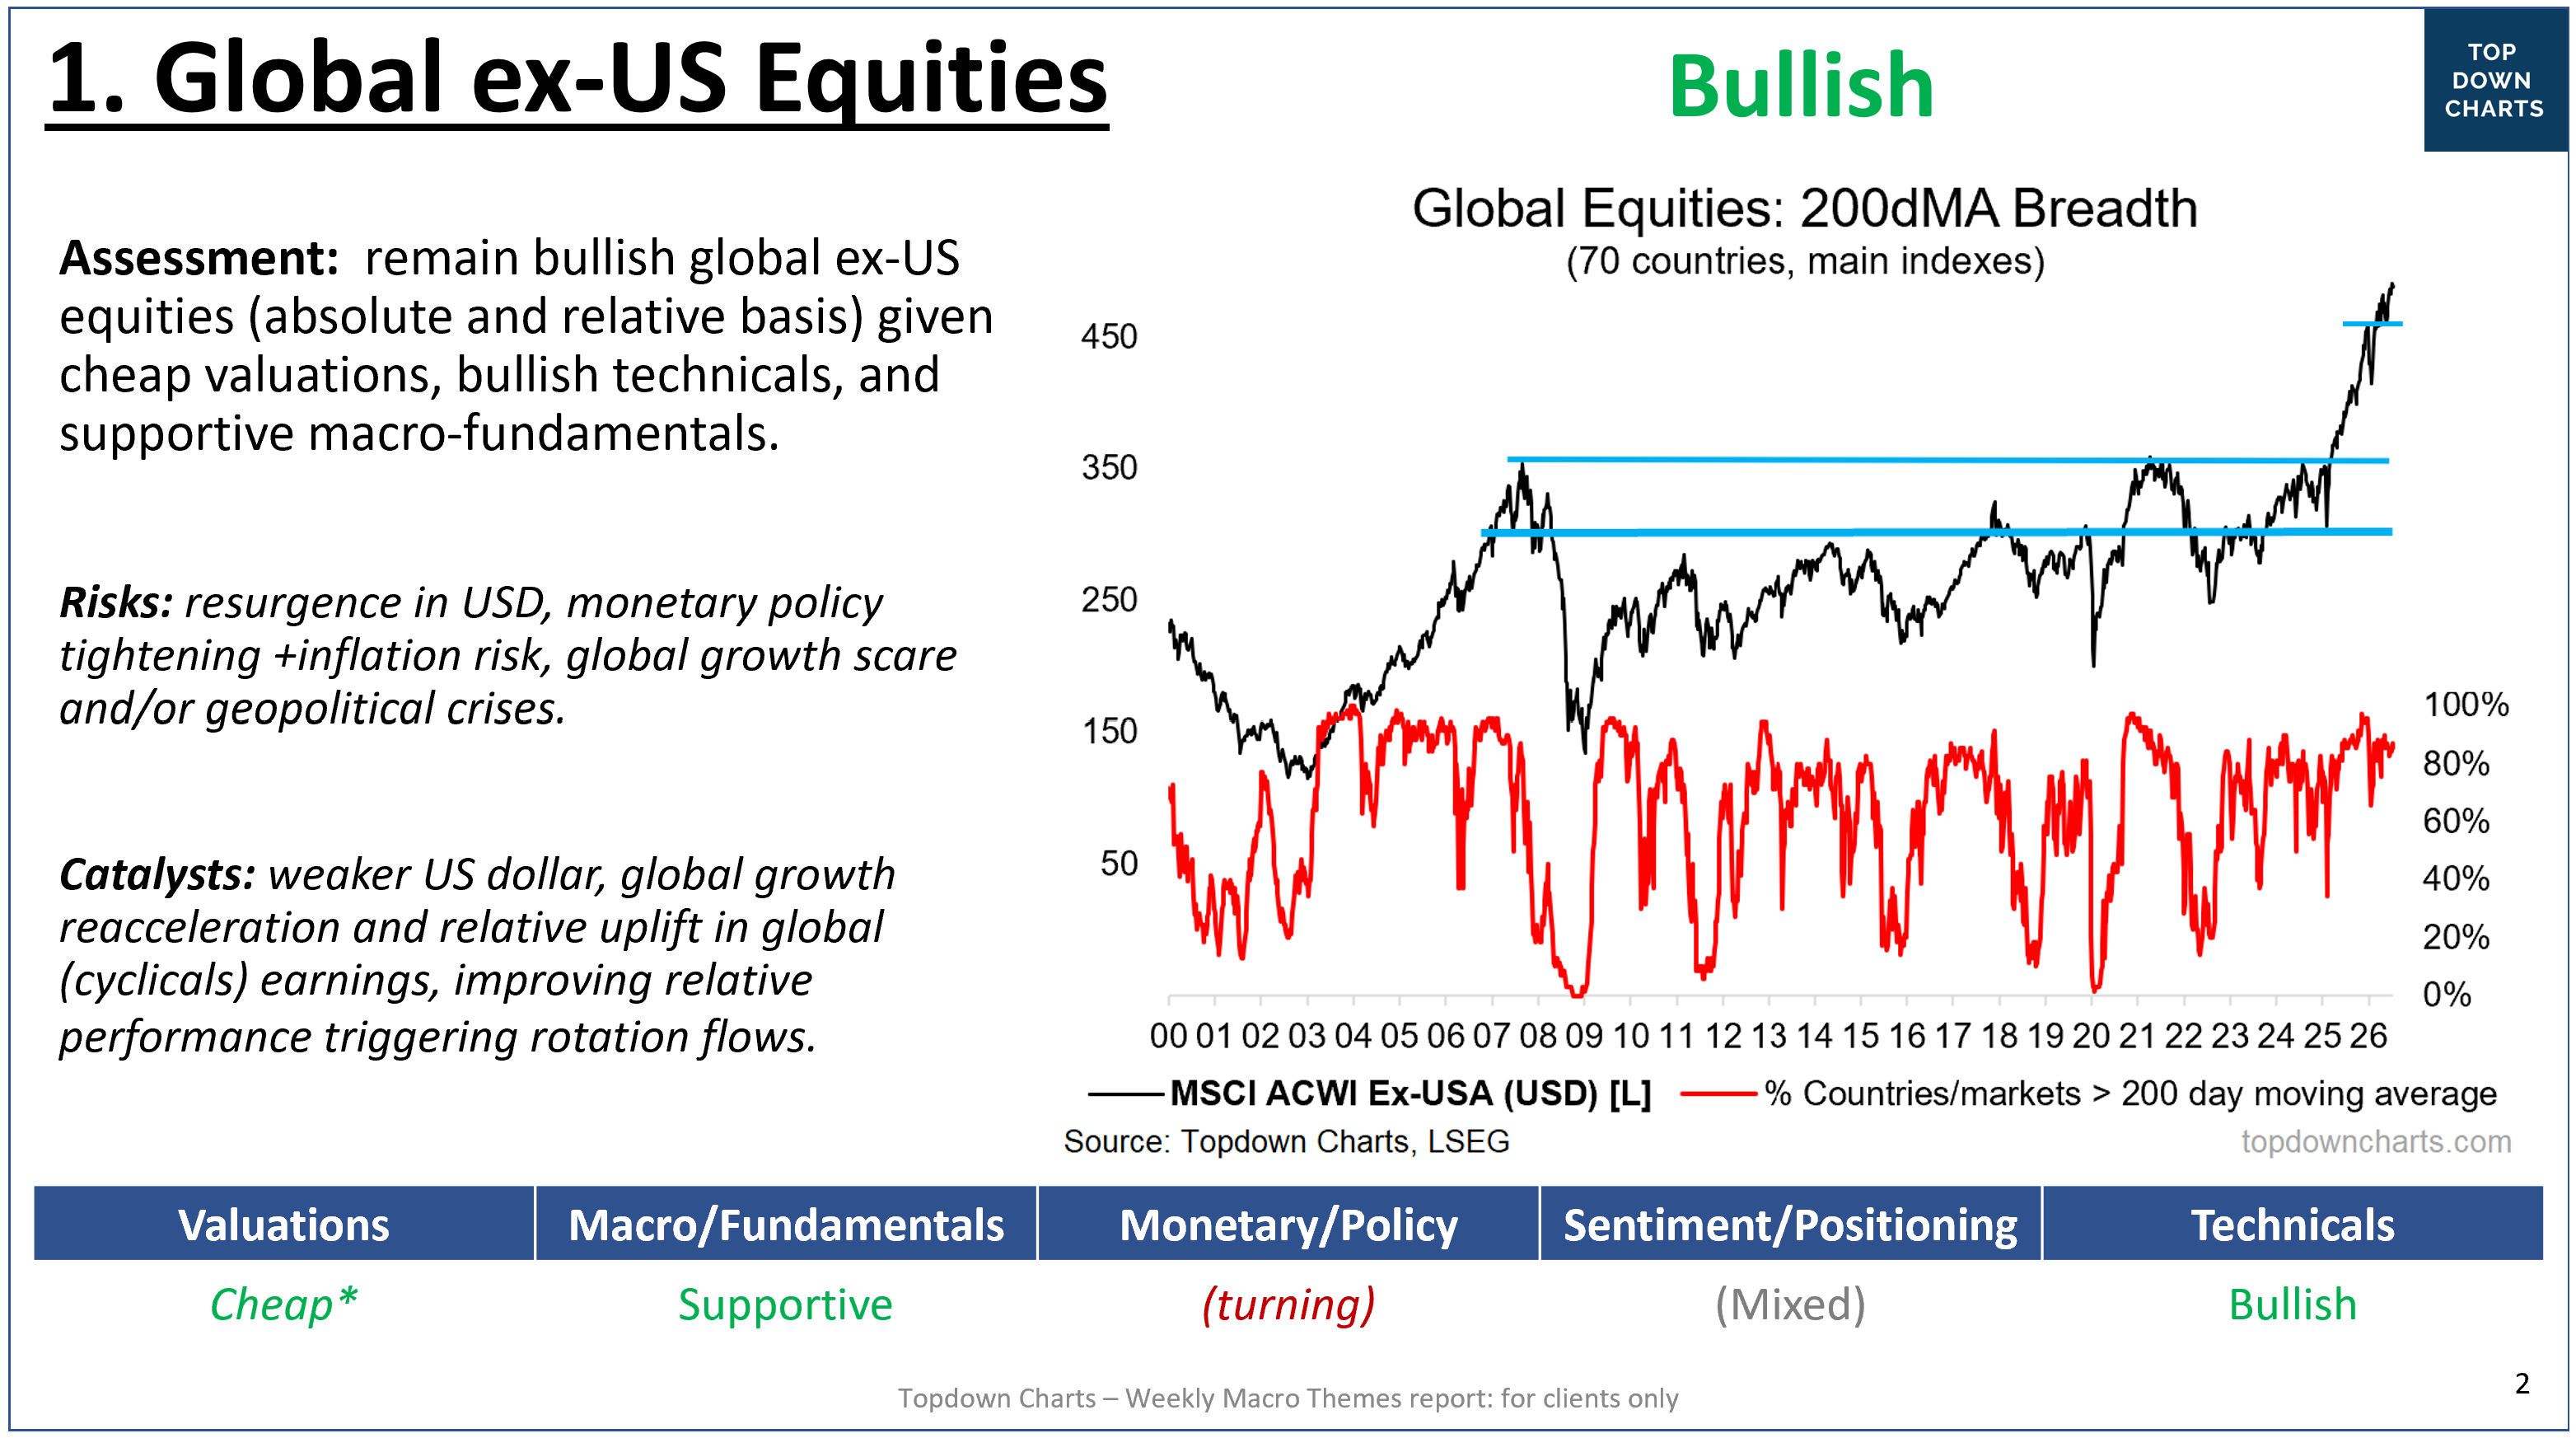
As you can see the overall assessment is bullish (this assessment is primarily for global ex-US [rest of world] equities in absolute terms, but the relative case is also decent). Let’s now go through the key charts behind this…
Policy and Valuations: for global ex-US equities, the technicals still look bullish (uptrend, strong breadth). However while policy settings are still in tailwind territory, they are turning and this will be a problem sooner or later (especially if we see higher inflation, more rate hikes, and growth wobbles in 2027). Valuations likewise are still reasonable, and very cheap vs USA – but have already moved up a lot.
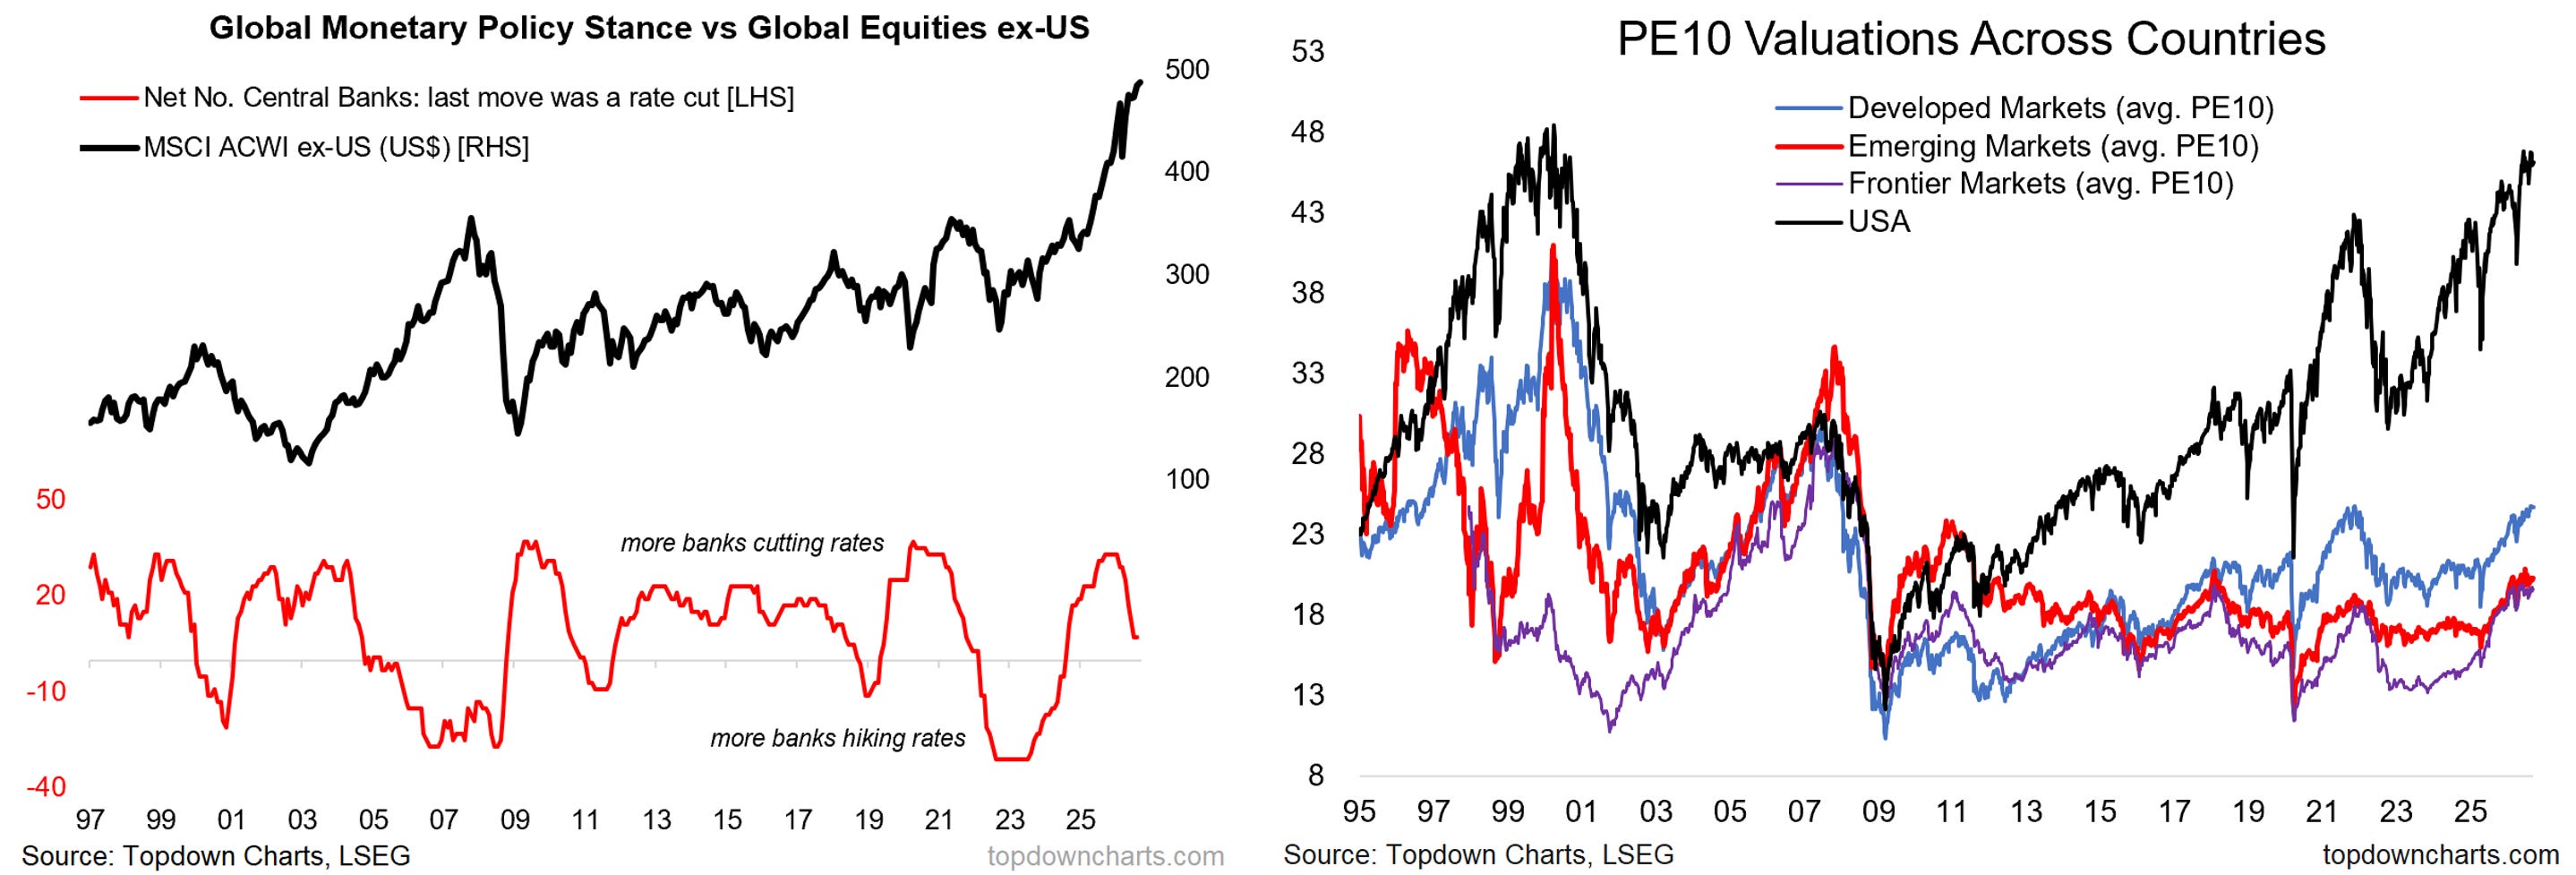
So the bull case has diminished significantly vs back in 2024/25 (when valuations were cheaper and policy was pivoting towards cuts vs pivoting towards hikes now). Still bullish, but less-so now.
[the latest Fed rate hike only adds to the global policy pivot to rate hikes, and reinforces this assessment —notably, the US is coming from a much higher valuation starting point, so the risks for US equities are arguable higher (as outlined last week)]
Relative Performance picture: as for relative performance, global continues the work in progress in turning the corner vs US after about 15-years of one-way traffic on this front (it takes time to turn). EM has been doing most of the heavy lifting so far, but DM is putting up a decent fight.
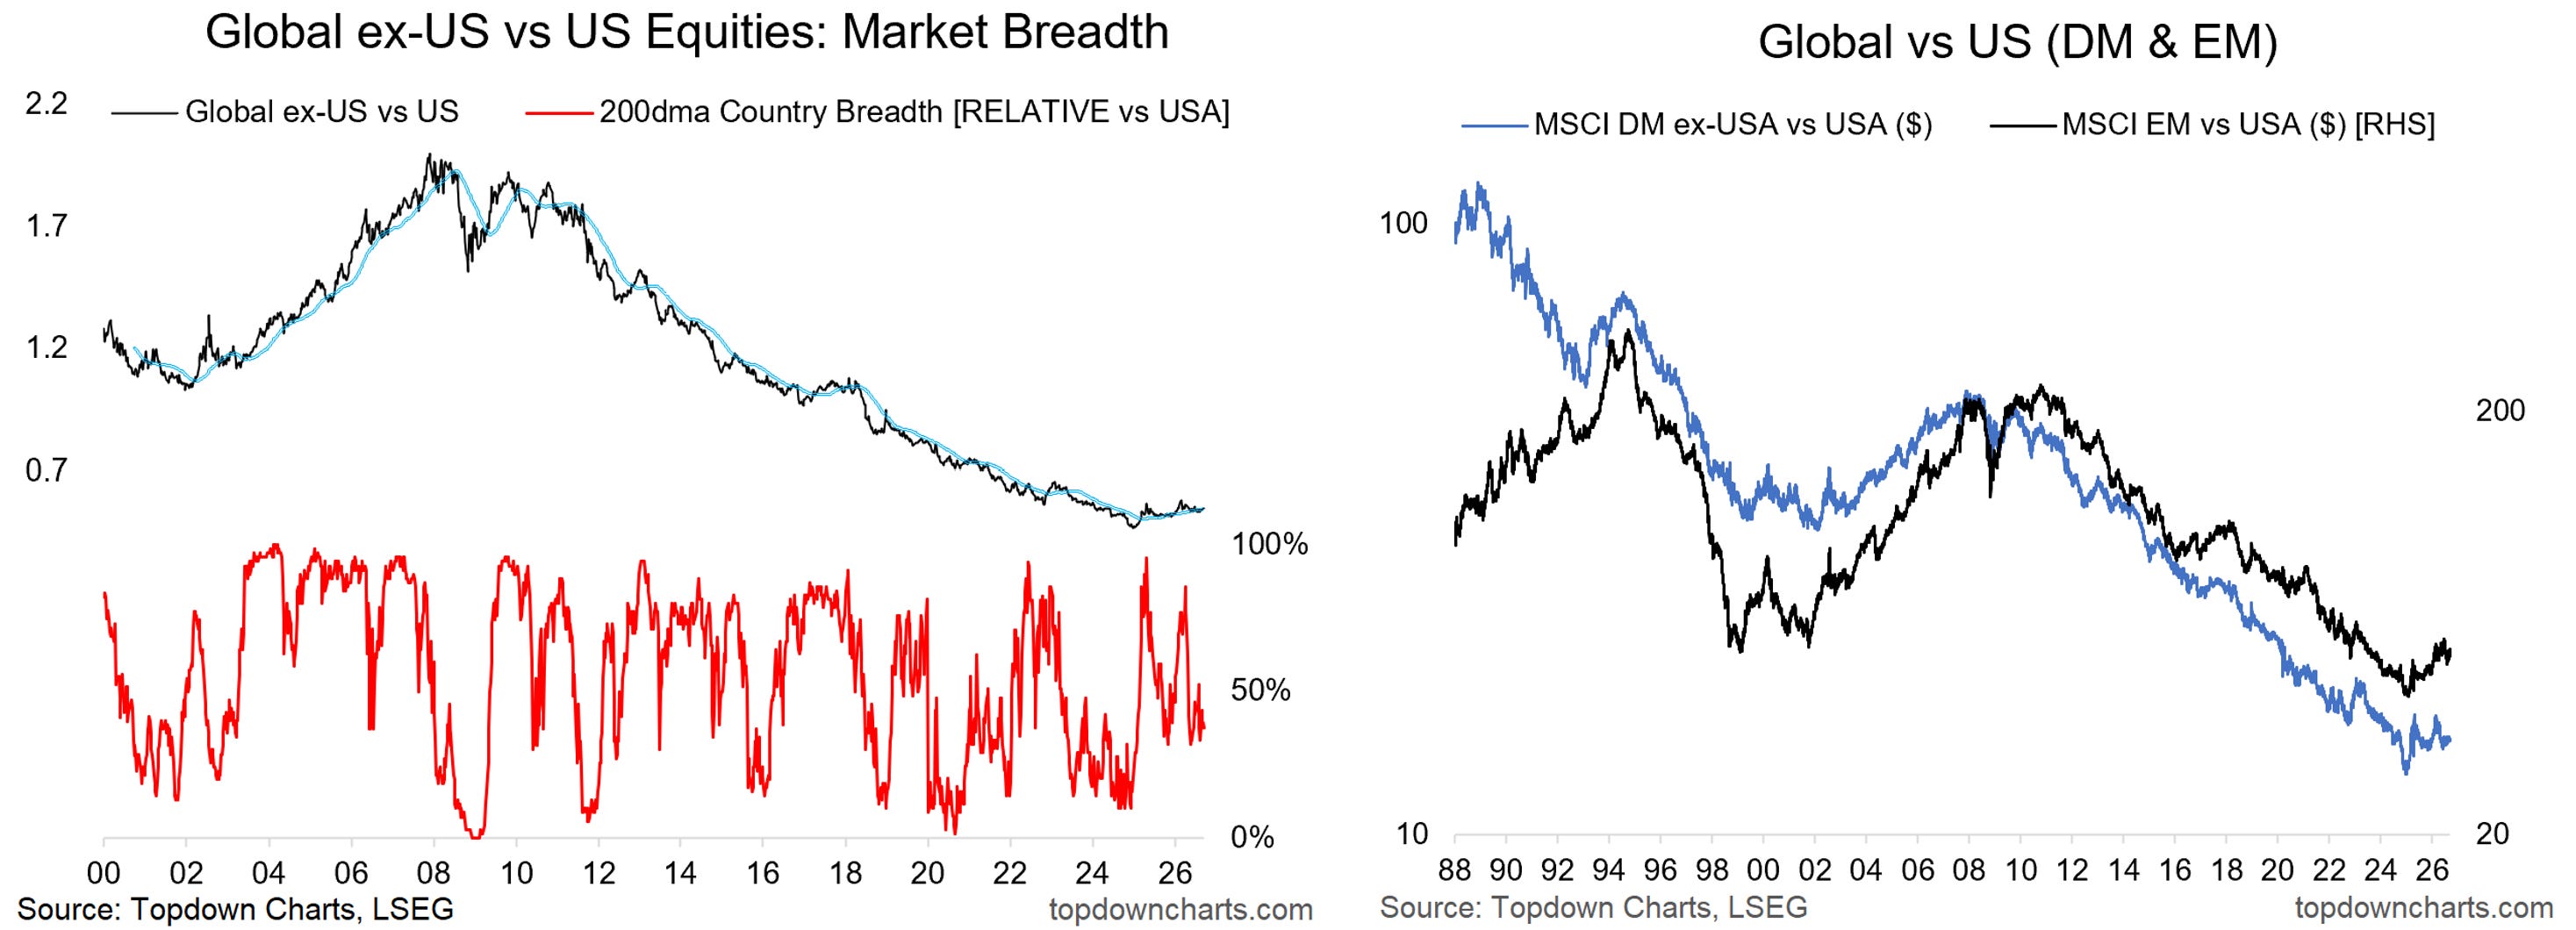
Relative breadth has been volatile, but notably is in a higher range (higher lows). Tentative turning point ticking away.
Relative Performance drivers: the value and technicals side of things support global vs US, but the macro/fundamental catalysts for a sustainable turn in global vs US equities’ relative performance has likewise been a bit stop-start. Namely, relative *earnings* performance is still favoring US (trending up), and the US dollar is holding support for now (after a brief bear run off the peak).
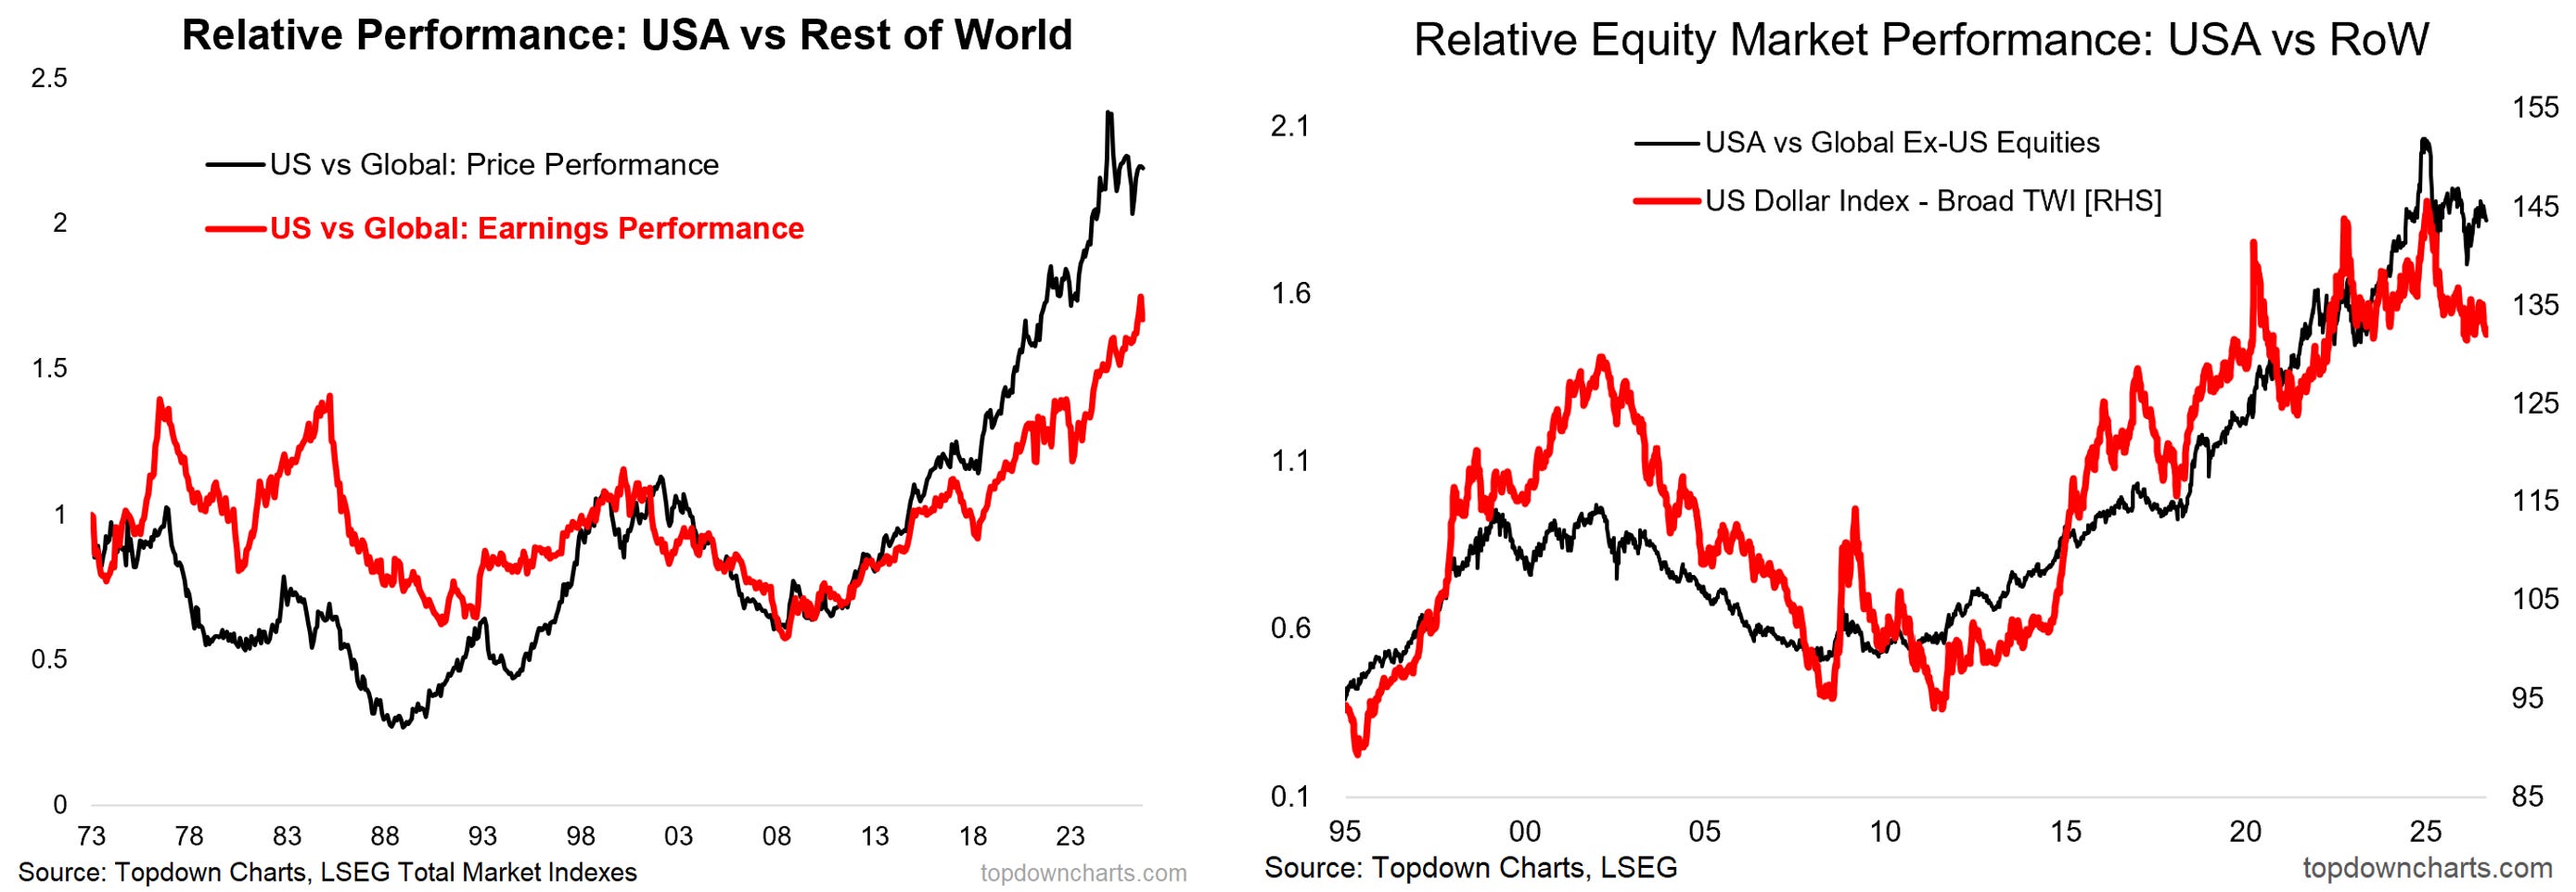
Basically you want to see a sustained period of US dollar weakness (downtrend in USD), and global earnings outgrowing US (ideally as a result of global strength). We need to see more progress here to raise conviction on global vs US.
Earnings: staying with the earnings picture, at the global ex-US level we are seeing global starting to play catch-up and break out of its stagnation on the earnings front.
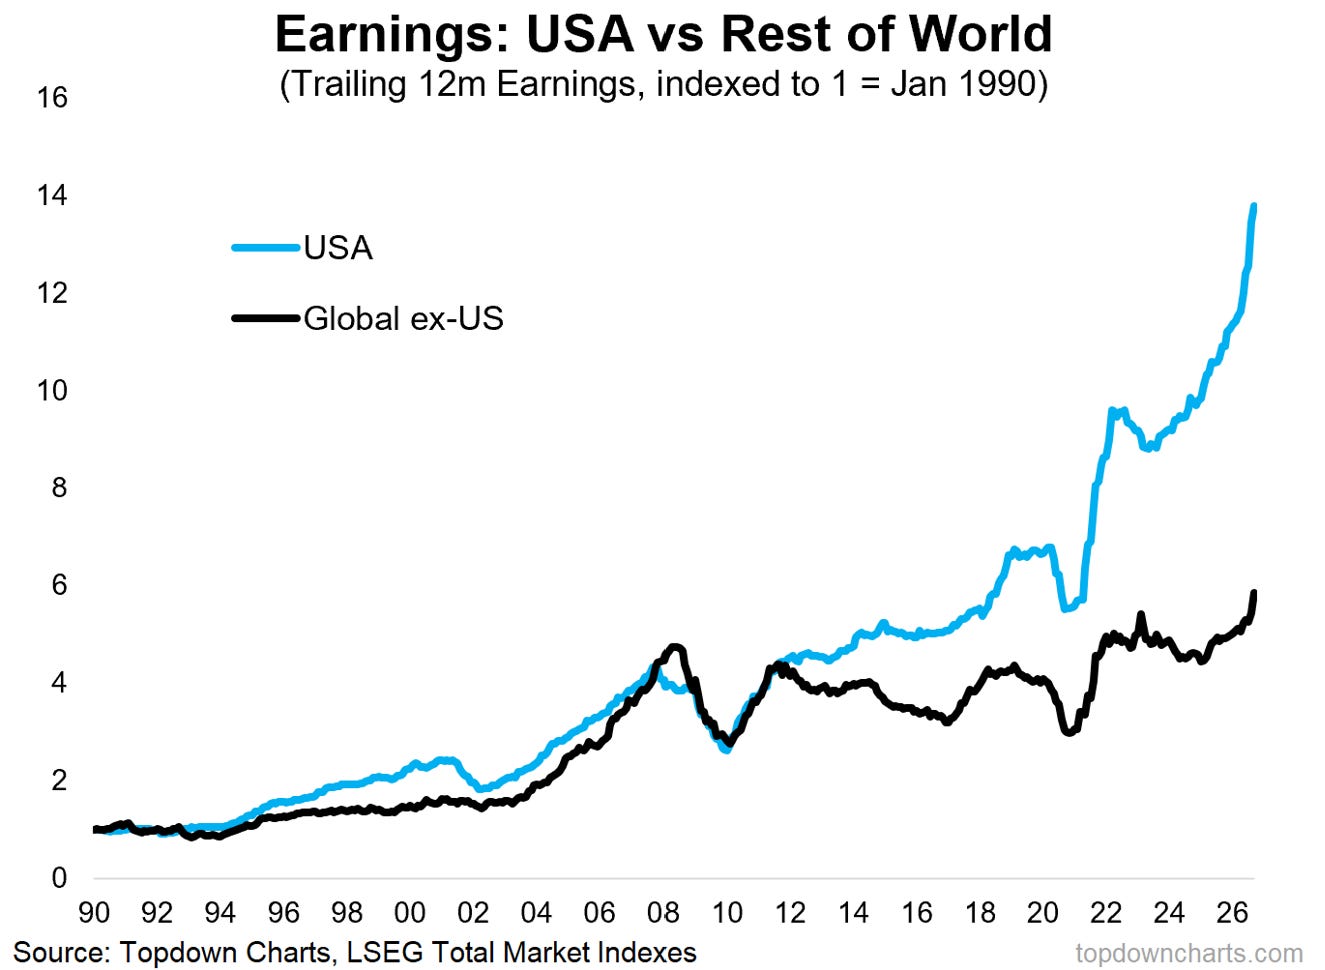
Notably all three major chunks of global equities are seeing upgraded long-term earnings growth expectations and a solid pace of improvement in forward EPS.
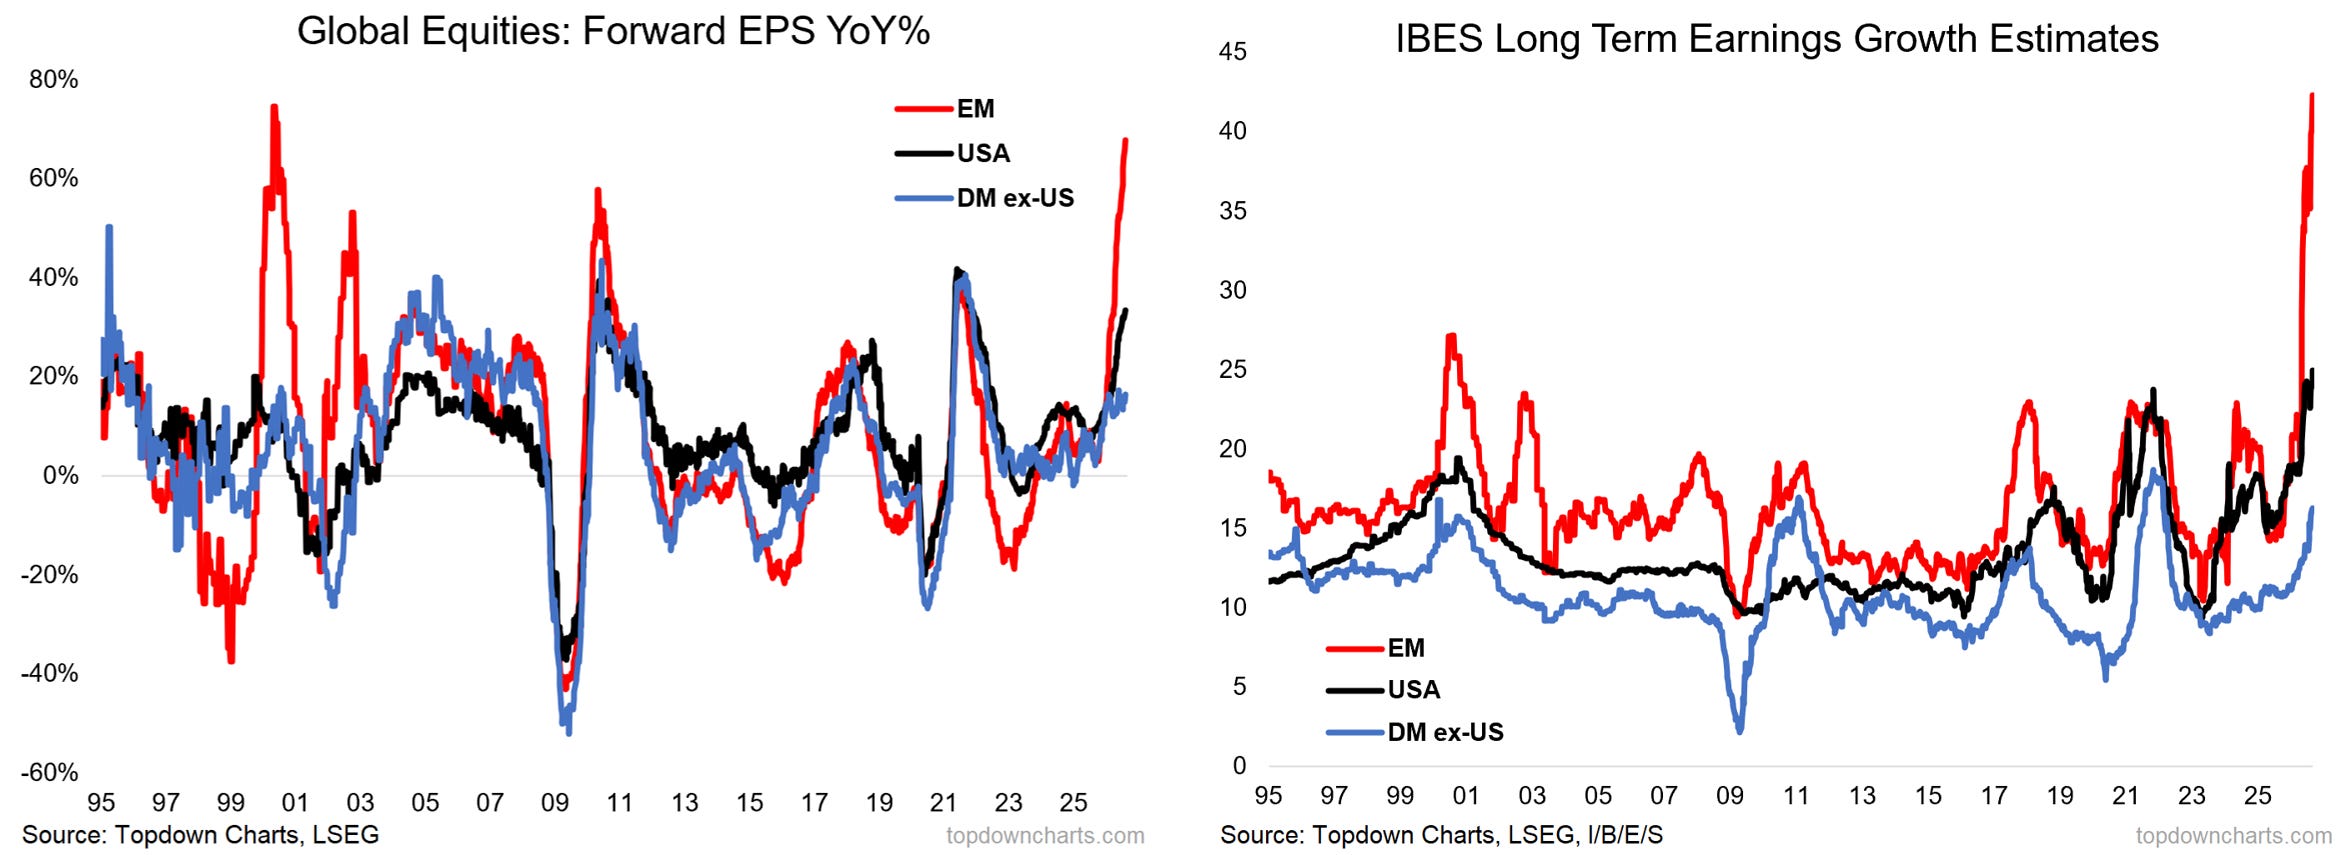
EM (Korea/Taiwan) is a key driver, but developed ex-US are also seeing earnings growth accelerate. This is a key support to the absolute and relative bull case for global ex-US equities.
Overall Conclusion…
As you can see there is a body of evidence pointing to a bullish outlook for global ex-US equities, but with valuations having already re-rated significantly and monetary policy pivoting to rate hikes globally, the risks are starting to shift (less favorable than the past couple of years).
On a relative basis it is still a work in progress, but improved earnings for global ex-US, tentative improvement in relative price performance, and still significantly cheap relative valuations it is worth keeping tabs on the key drivers/catalysts to gain conviction on the relative outlook for global vs US stocks.
Thanks for reading! Reply to this email if you have any questions.
—
Best wishes,
Callum Thomas
Head of Research at Topdown Charts
Connect: LinkedIn | Twitter/X | Substack
p.s. What do you reckon?
Please provide feedback below (reply by email if you had any specific points)
Also, in case you missed it: be sure to check out the previous note — in this post you will find more macro market musings +a key chart on commodities vs macro cycles [and vote in this week’s survey!]
![[Chart] Commodity Cycling](https://substackcdn.com/image/fetch/$s_!xYz3!,w_1300,h_650,c_fill,f_webp,q_auto:good,fl_progressive:steep,g_auto/https%3A%2F%2Fsubstack-post-media.s3.amazonaws.com%2Fpublic%2Fimages%2F75026e35-0bf5-4bf5-8f6c-f88e5bfcb062_1447x972.png)
Learn more about Topdown Charts —> this post explains what Topdown Charts does + The Topdown Charts Framework for monitoring macro & markets to consistently generate profitable ideas:

Topdown Charts Research Digest — Archives
Click through for more free updates and insights from Topdown Charts:
Disclaimer: the information provided by Callum Thomas, Topdown Charts, and related content is for informational and educational purposes only and should not be construed as investment, financial, or trading advice. Nothing in this publication constitutes a recommendation, solicitation, or offer to buy or sell any securities, commodities, or financial instruments.
All investments carry risk, and past performance is not indicative of future results. Readers should conduct their own research and consult with a qualified financial advisor before making any investment decisions. The author and publisher disclaim any liability for financial losses or damages incurred as a result of reliance on the information provided.