

Note: this is a new series for free subscribers to give an insight into my work at Topdown Charts (+deliver some useful and timely takeaways!)
Chart: Fed is a Go for Rate Hikes
The fed funds rate should be at 5%.
(based on its usual reaction to inflation expectations + the labor market)
That’s over 100bps higher from where it is currently sitting (3.75%), so the Fed has some work to do following its “moment of hesitation“.
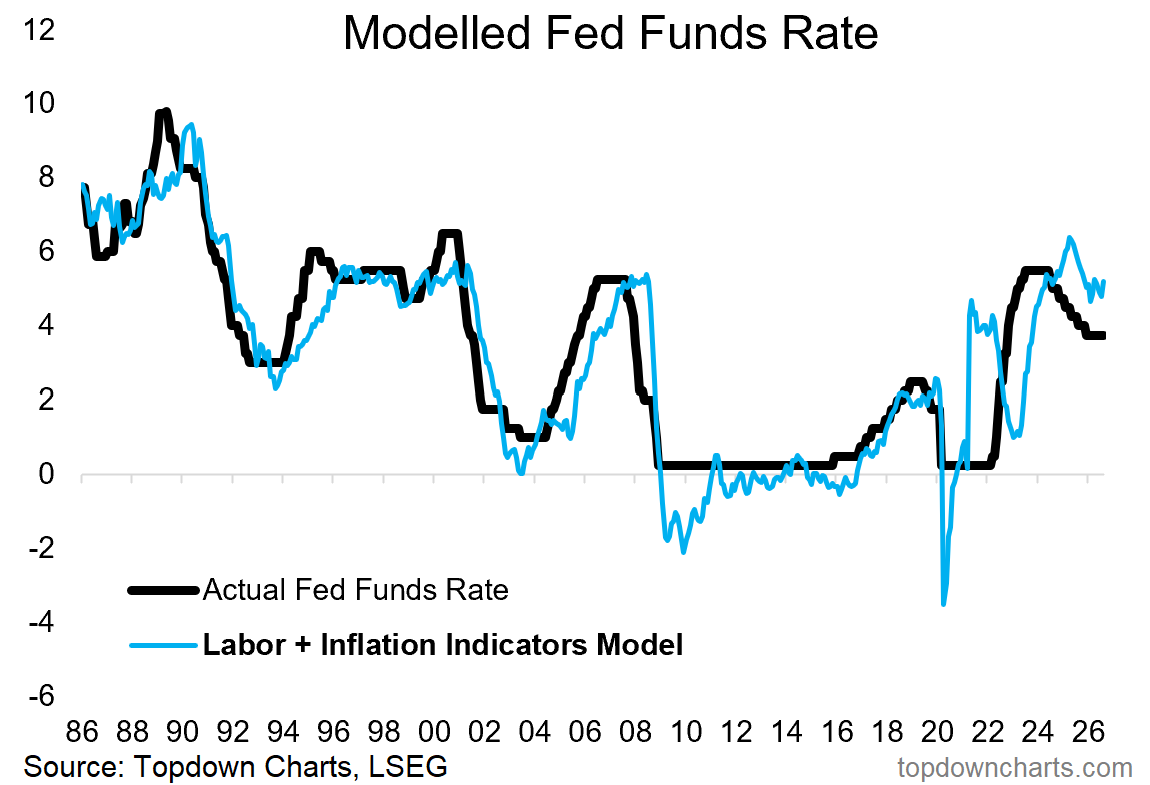
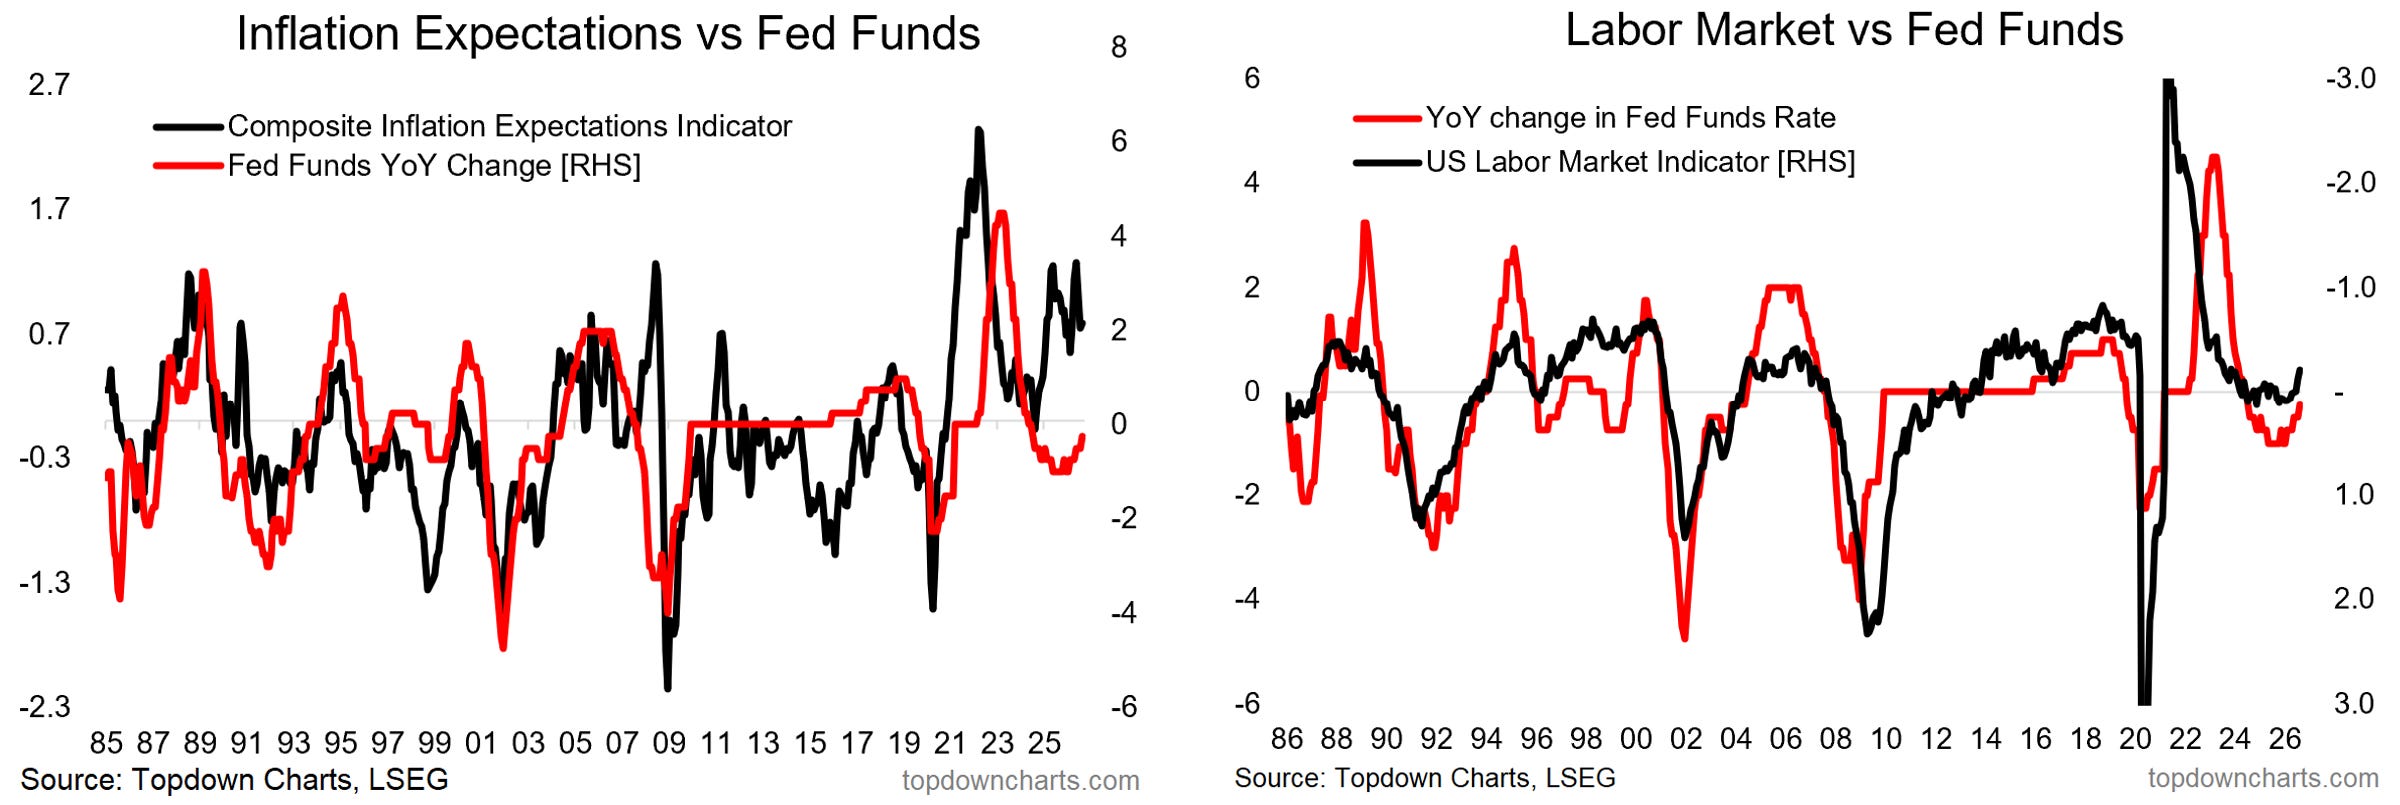
The chart above models where the implied level the fed funds rate would normally be sitting at based on inflation expectations and the labor market. The two charts below spell it out frame-by-frame.
Inflation expectations have been anchored into a new higher range.
The labor market is heating up again and remains tight.
Meanwhile markets are calm, financial conditions are easy, and bond yields have already edged higher in anticipation. Furthermore, globally we’ve also already seen a broad-based pivot to rate hikes (over 40% of central banks around the world have shifted into rate hike mode).
At this point I would be shocked (/suspicious) if they didn’t just get on with it.
Fed Rate Hikes — What do you think?
(what do you think the most likely outcome is? [FOMC 15-16 September])
ALSO — what impact do you think rate hikes will have (if the Fed does hike)
Further Thoughts: Reaction Trigger — correction coming?
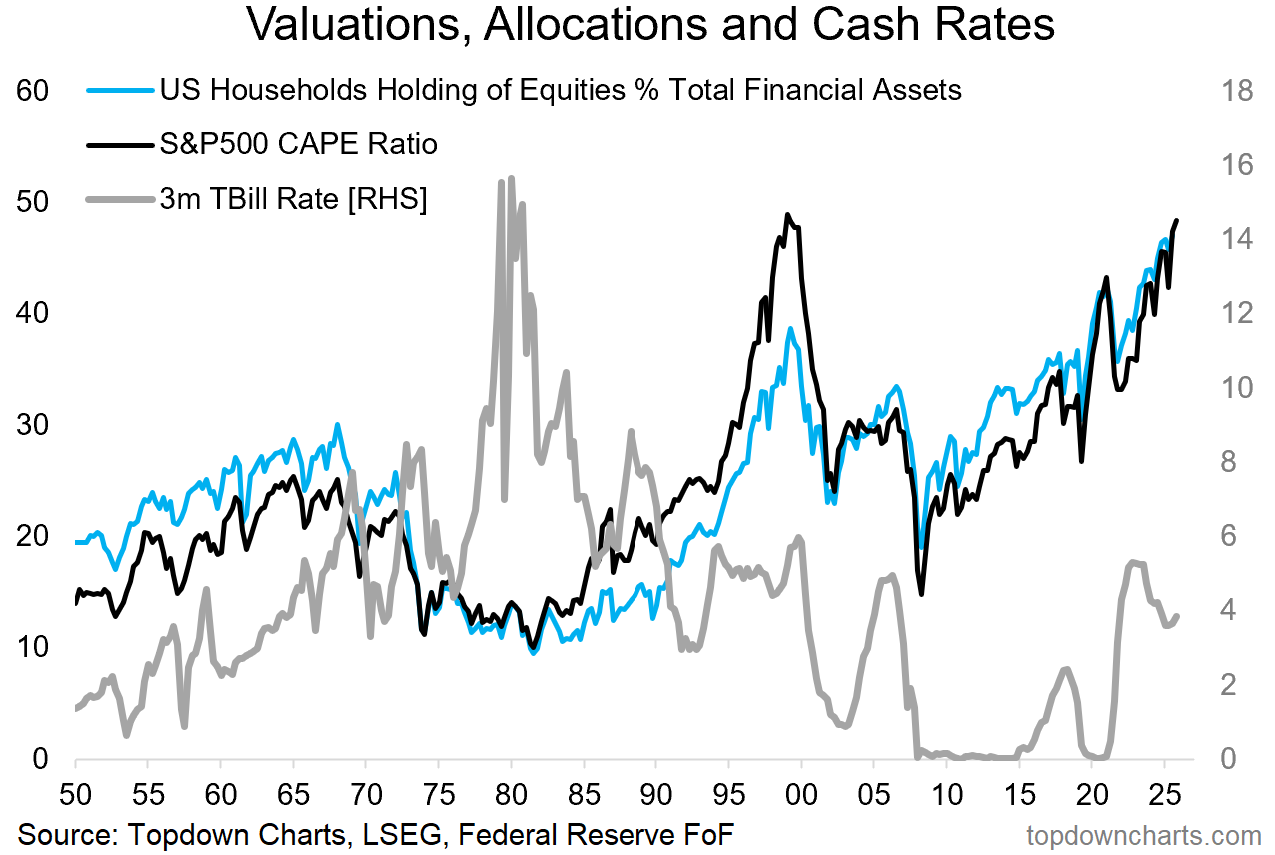
I previously outlined how the US Stockmarket is trading at record high valuations and allocations. Basically the US stockmarket is overvalued, overallocated, and overhyped from a sentiment standpoint.
This represents a state of vulnerability.
It’s a classic contrarian bearish setup (just waiting for a catalyst).
While a September rate hike might not come as too much of a surprise at this point (especially following the hawkish-hued Jackson Hole speech from Warsh), there are plenty of examples of hikes triggering off weakness in stocks and acting as a catalyst… i.e. a spark to powder.
The usual pattern is for a series of hikes to build up pressure on the economy and weigh on investor behavior —bringing the cycle to an end by basically damaging something in the economy and naturally resulting in a bear market.
But in the more immediate term, there is the matter of seasonality…
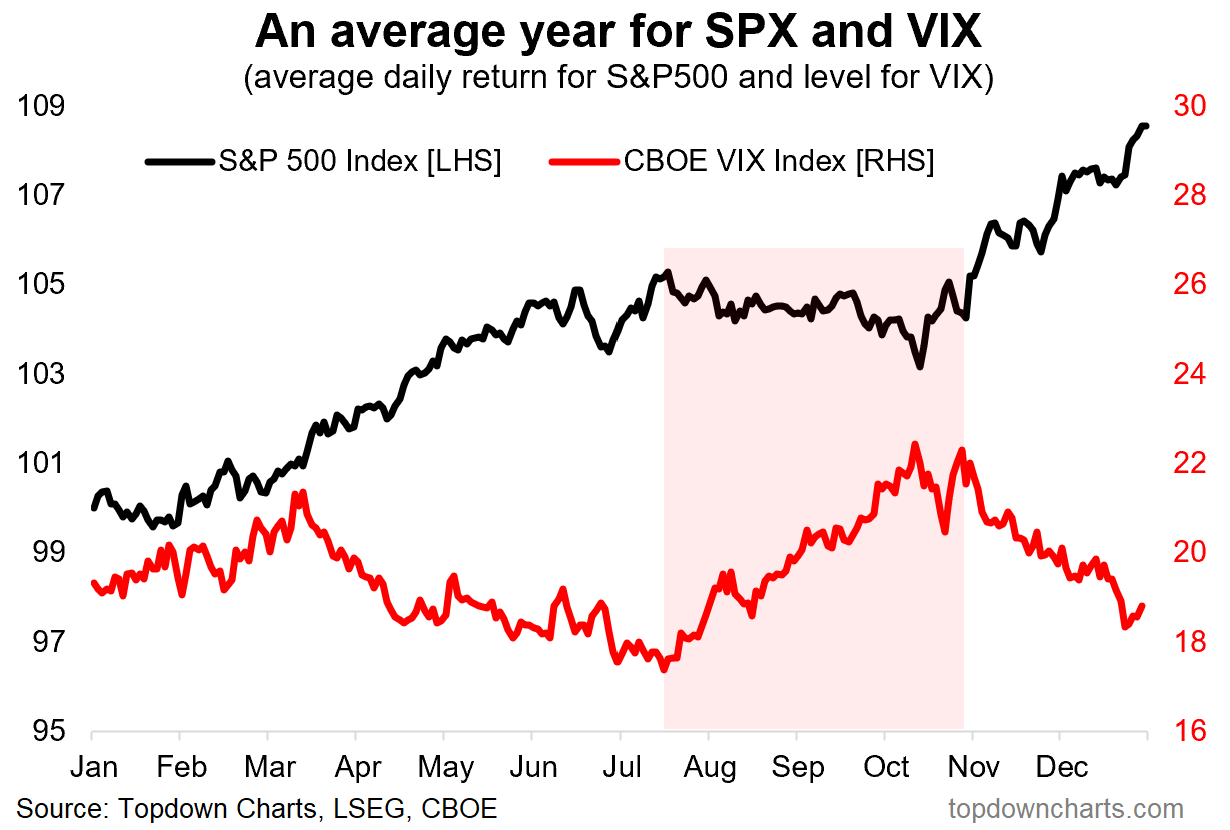
The way I look at seasonality is either a prompt to take a look at something and see if there is an evidence-based case that lines up with it, or where you already have an evidence/data-driven and well-rounded thesis where seasonality lines up with your view and it confirms.
With the US stockmarket looking stretched, it’s entirely possible that a rate hike could be the camel that breaks the straw’s back, and gets us into that typical seasonal pattern of rising volatility and falling stocks in Sep/Oct.
And then staying with seasonality, maybe a big enough correction could reset value/sentiment/positioning enough and give the Fed cause for pause …and then all of a sudden you’re looking at a typical year-end seasonal rally.
Certainly a scenario to simmer on…
Weekly Report Notes
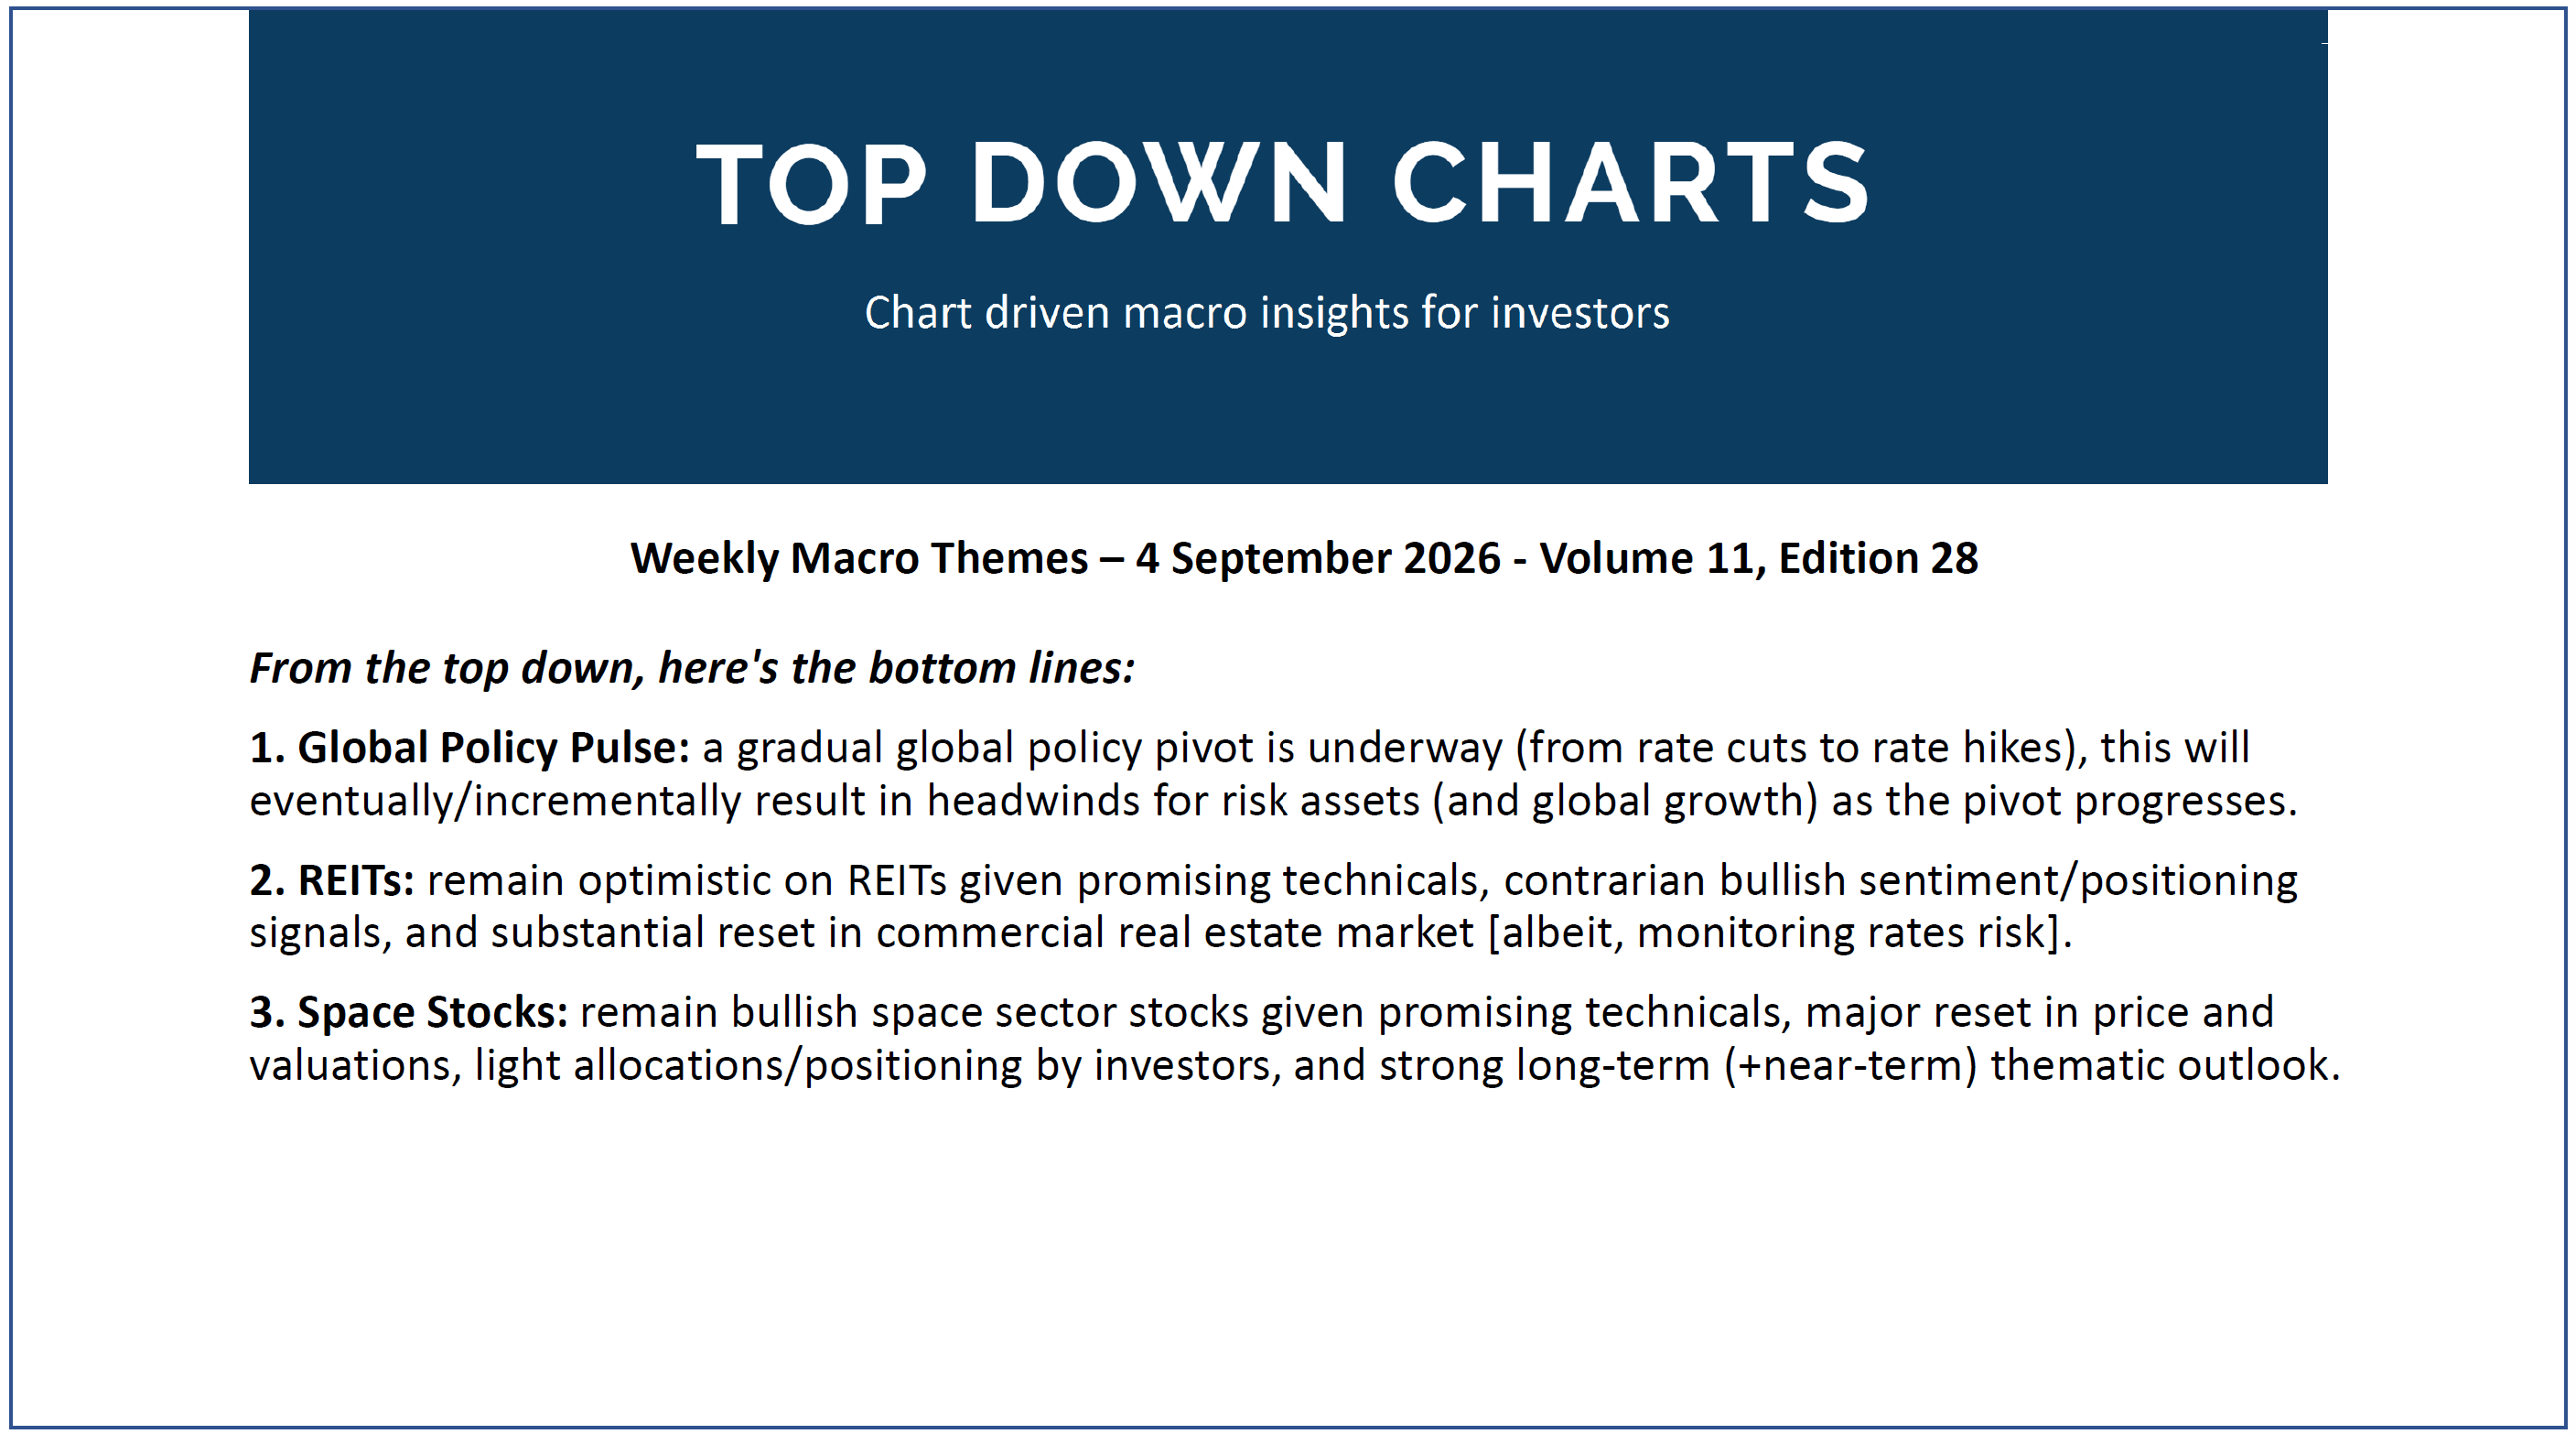
Here’s the topics & takeaways from my latest report —it should give a good sense of what I tend to cover in the Topdown Pro service as well as providing some high-level insights into how I am currently seeing Macro & Markets:
1. Global Policy Pulse: a gradual global policy pivot is underway (from rate cuts to rate hikes), this will eventually/incrementally result in headwinds for risk assets (and global growth) as the pivot progresses.
2. REITs: remain optimistic on REITs given promising technicals, contrarian bullish sentiment/positioning signals, and substantial reset in commercial real estate market [albeit, monitoring rates risk].
3. Space Stocks: remain bullish space sector stocks given promising technicals, major reset in price and valuations, light allocations/positioning by investors, and strong long-term (+near-term) thematic outlook.
Thanks for reading! Reply to this email if you have any questions.
—
Best wishes,
Callum Thomas
Head of Research at Topdown Charts
Connect: LinkedIn | Twitter/X | Substack
p.s. What do you reckon?
Please provide feedback below (reply by email if you had any specific points)
Also, in case you missed it: be sure to check out the previous note — in this post you will find more macro market musings + a key chart on the US Dollar outlook [and last week’s survey results!!]
![[Chart] US Dollar Decision Point](https://substackcdn.com/image/fetch/$s_!rSl6!,w_1300,h_650,c_fill,f_webp,q_auto:good,fl_progressive:steep,g_auto/https%3A%2F%2Fsubstack-post-media.s3.amazonaws.com%2Fpublic%2Fimages%2F20dfcf5e-84ee-42ab-a657-391fa83d7965_1182x910.png)
Learn more about Topdown Charts —> this post explains what Topdown Charts does + The Topdown Charts Framework for monitoring macro & markets to consistently generate profitable ideas:

Topdown Charts Research Digest — Archives
Click through for more free updates and insights from Topdown Charts:
Thanks for reading, learn more: about Topdown Charts