

Note: this is a new series for free subscribers and is intended to give an insight into the work that goes on at Topdown Charts (+deliver some useful and timely takeaways).
Chart: The Big CRE Reset
The US Commercial Real Estate (CRE) market has just been through its third major correction in 40 years. Indeed, the 2020’s downturn has been similar in magnitude to the early-90s downturn and 2008 crisis.
But a couple of interesting things stand out.
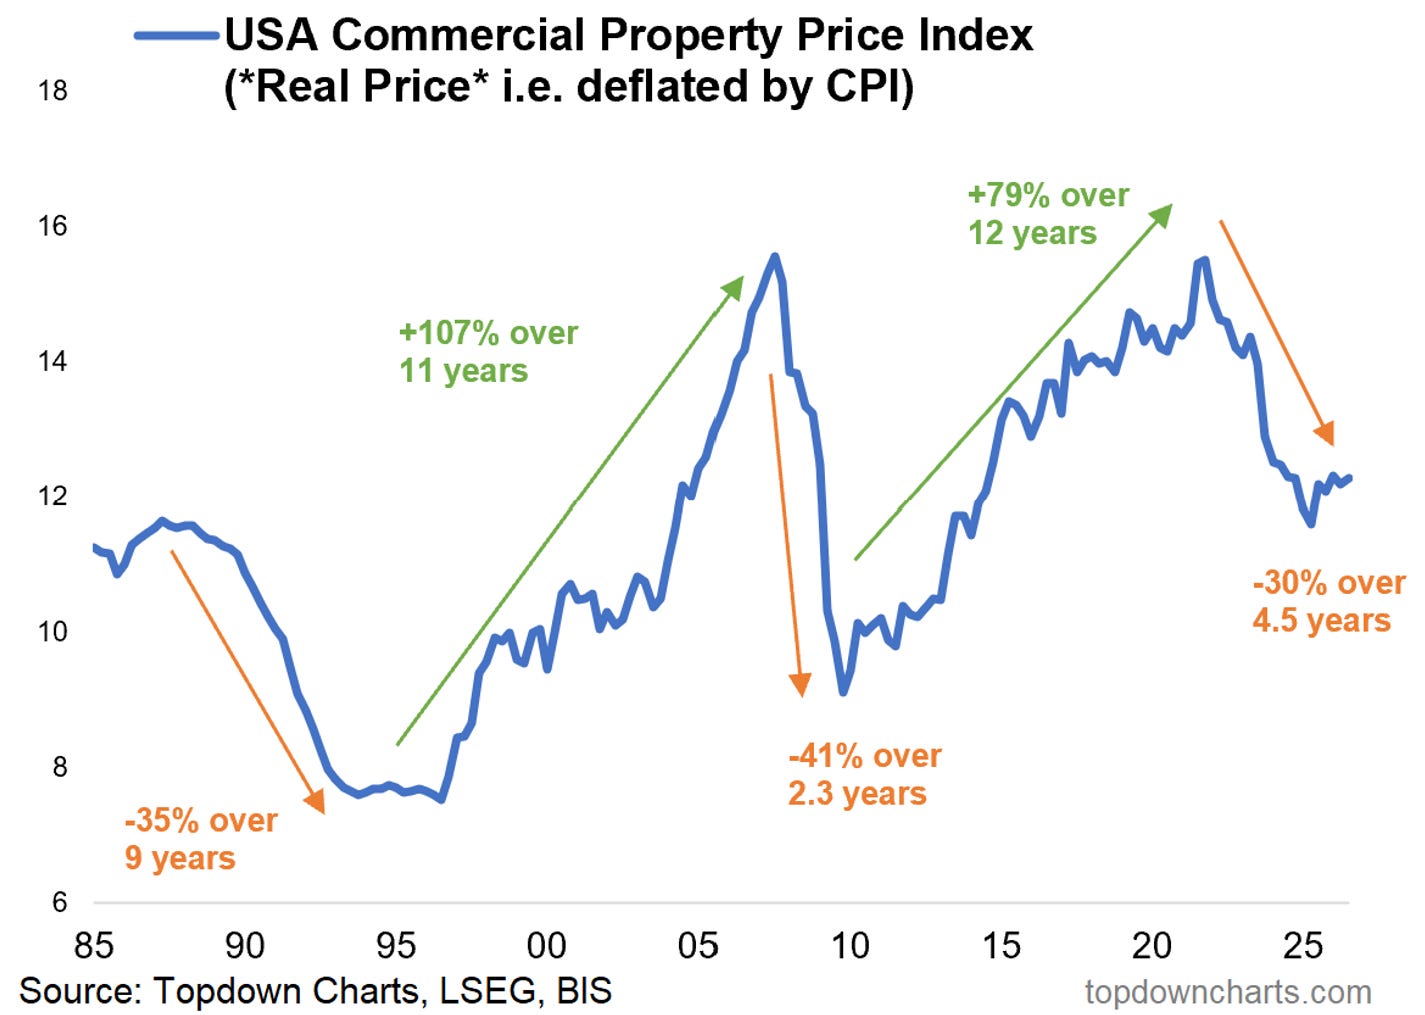
First, those other two major corrections in the commercial real estate market sowed the seeds for decadal booms (a possibility that is completely out of mind for most investors as sentiment on real estate remains deeply pessimistic).
The other point of interest is that the bottom looks to already be in, and prices are stabilizing and ticking up again... While there may still be risks, this is the type of thing investors should pay particular attention to, and is exactly the type of setup I hunt for in my work at Topdown Charts.
US Commercial Real Estate — What do you think?
(what’s your core-view/how are you positioned: Commercial Real Estate?)
Bonus Chart: REITS on the Rise
Meanwhile if we look at US REITs there is a very bullish technical setup. US REITs have made an initial breakout against a major overhead resistance level.
This is particularly interesting in the context of the previous chart.
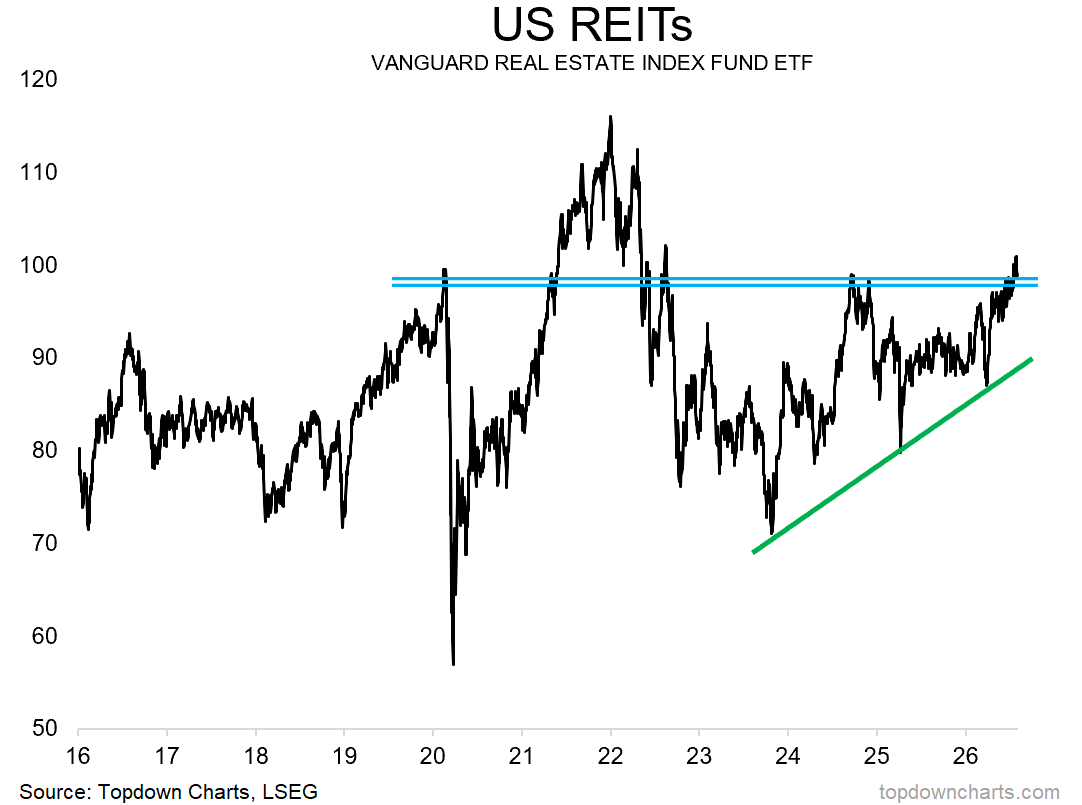
It’s also interesting to see resilience in REITs despite rising rates, and interesting to see this bullish price picture set against record low allocations by investors to REITs.
And then you think about the cheap relative valuations for REITs + prospect of rotation flows into underowned sectors like REITs as AI/Big Tech leaders turn to laggards.
Hence this overlooked and underestimated sector is well worth a second look.
Weekly Report Notes
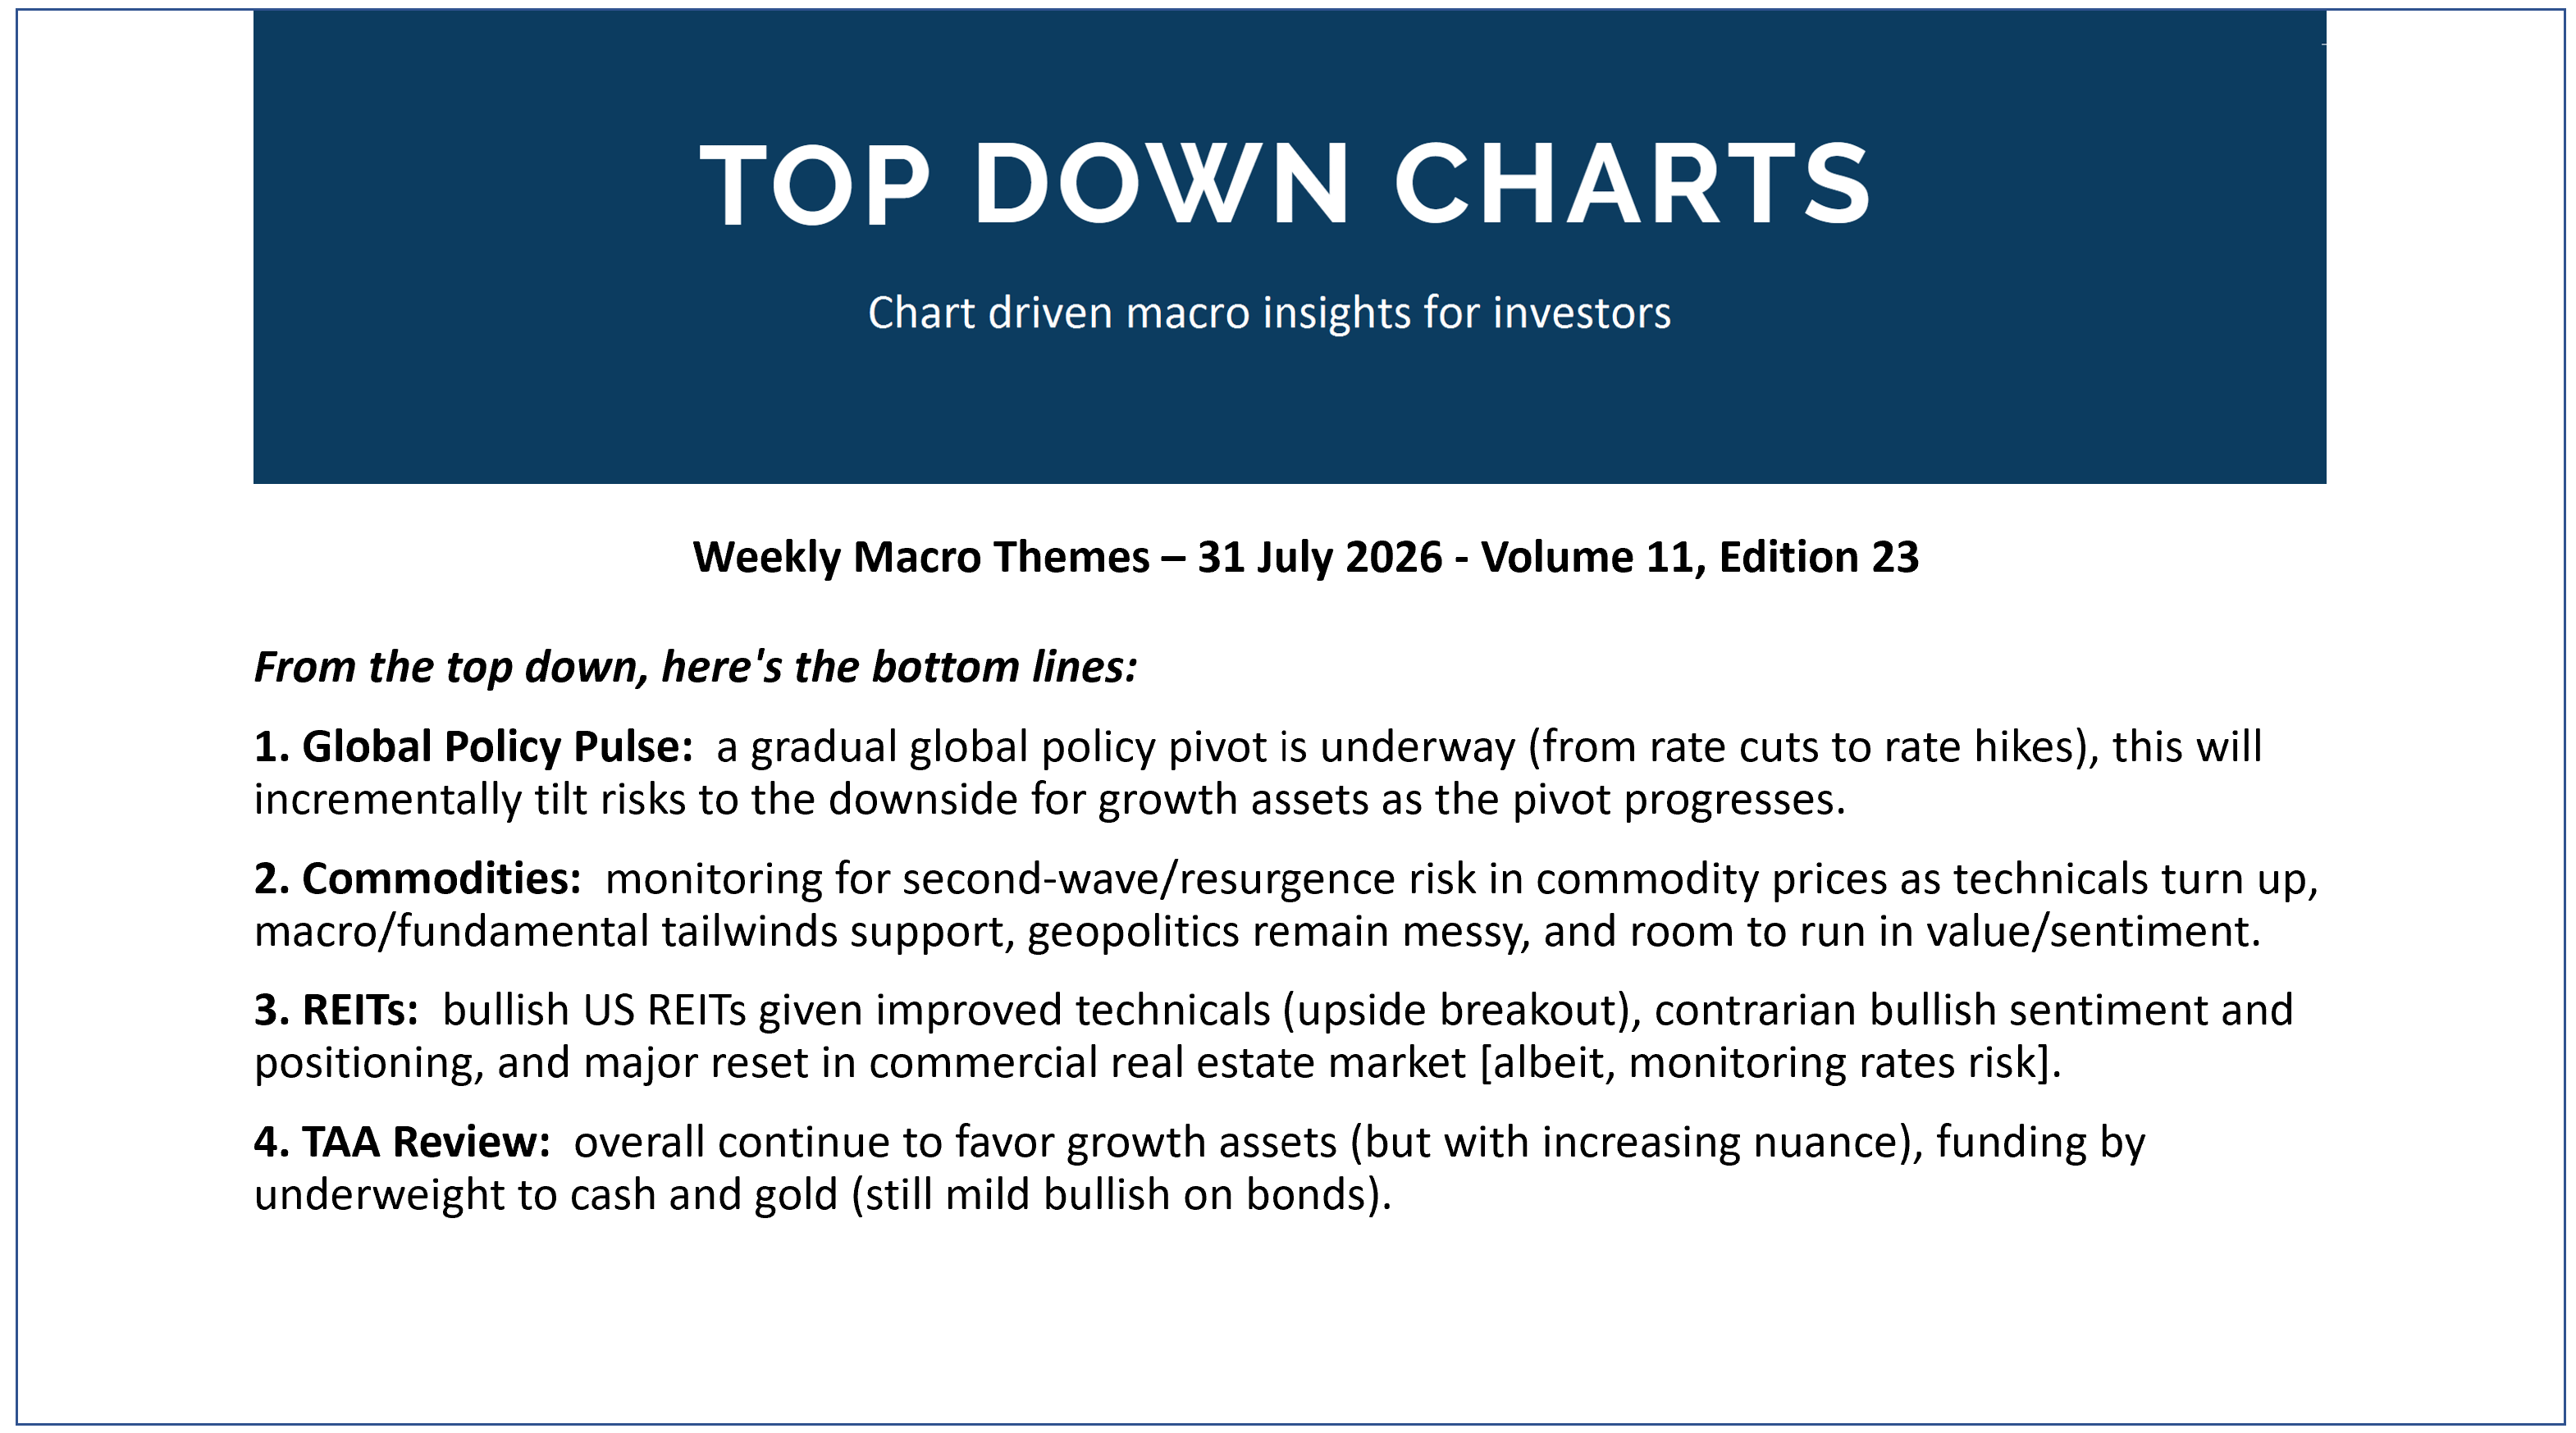
Here’s the topics & takeaways from my latest report —it should give a good sense of what I tend to cover in the Topdown Pro service as well as providing some high-level insights into how I am currently seeing Macro & Markets:
1. Global Policy Pulse: a gradual global policy pivot is underway (from rate cuts to rate hikes), this will incrementally tilt risks to the downside for growth assets as the pivot progresses.
2. Commodities: monitoring for second-wave/resurgence risk in commodity prices as technicals turn up, macro/fundamental tailwinds support, geopolitics remain messy, and room to run in value/sentiment.
3. REITs: bullish US REITs given improved technicals (upside breakout), contrarian bullish sentiment and positioning, and major reset in commercial real estate market [albeit, monitoring rates risk].
4. TAA Review: overall continue to favor growth assets (but with increasing nuance), funding by underweight to cash and gold (still mild bullish on bonds).
Thanks for reading! Reply to this email if you have any questions.
—
Best wishes,
Callum Thomas
Head of Research at Topdown Charts
Connect: LinkedIn | Twitter/X | Substack
p.s. What do you reckon?
Please provide feedback below (reply by email if you had any specific points)
Also, in case you missed it: be sure to check out the previous note — in this post you will find more macro market musings +an incredible chart documenting the plight of bond investors… [and last week’s survey results!!]
![[Chart] The Big Bad Bond Bear](https://substackcdn.com/image/fetch/$s_!vusg!,w_1300,h_650,c_fill,f_webp,q_auto:good,fl_progressive:steep,g_auto/https%3A%2F%2Fsubstack-post-media.s3.amazonaws.com%2Fpublic%2Fimages%2F09c9f9ca-4323-4703-bde2-1bc79c2e53db_1295x860.png)
Learn more about Topdown Charts —> this post explains what Topdown Charts does + The Topdown Charts Framework for monitoring macro & markets to consistently generate profitable ideas:
