

Note: this is a new series for free subscribers to give an insight into my work at Topdown Charts (+deliver some useful and timely takeaways).
Chart: US Dollar Decision Point
Every so often you come across a chart like this where there is a big long-term technical tension playing out. Bears will highlight the Lower major Highs (drawing the red line), bulls will highlight the Higher major Lows (drawing the green line). Both of them are right, and that’s the point.
The technical tension = simultaneous up & down trends vying for dominance.
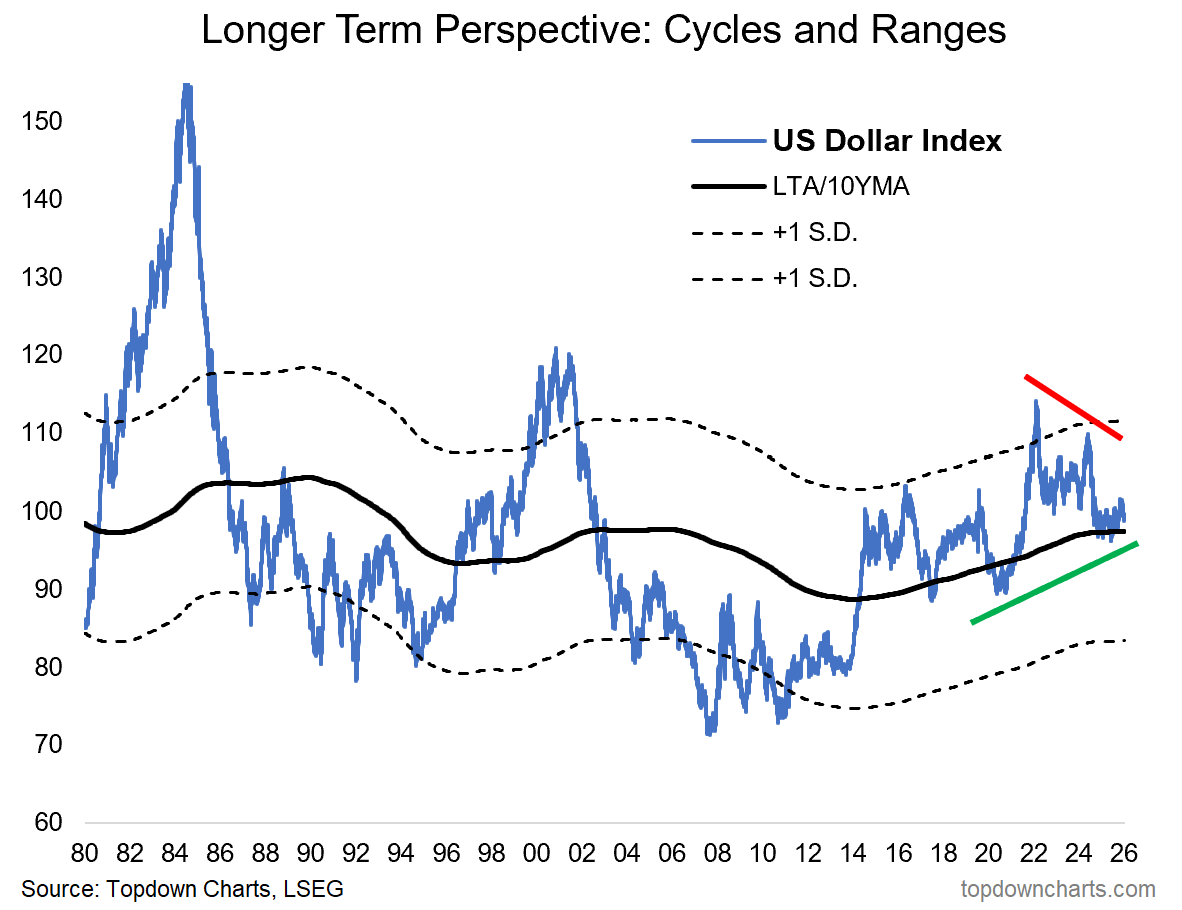
I’ve seen this type of thing play out many times before across different assets and markets, and the resultant move tends to be violent, substantial, and sets the tone for many years to follow. And I see this setup here as no different. But then you also consider the macro influence of the US dollar, and you realize that this is not just a major issue for asset allocators and traders, but something that could have far reaching impacts.
Up until recently I had been stubbornly bearish on the US dollar (as a medium/long-term cyclical call), but as noted in my latest report I see a window for a rally —what I don’t see yet however is a resolution to this chart. But it’s something I am spending a lot of time on, and watching very closely… and I suggest you do too!
US Dollar Outlook — What do you think?
(US Dollar [DXY/basket] what’s your core-view/how are you positioned?)
Reminder: this weekend marks the 10-year Anniversary of me leaving big corporate to start Topdown Charts as a small independent — I will be holding a live AMA/Q&A session to celebrate and reflect on the past decade of charts. [Details + Link to Live Stream]
Weekly Report Notes
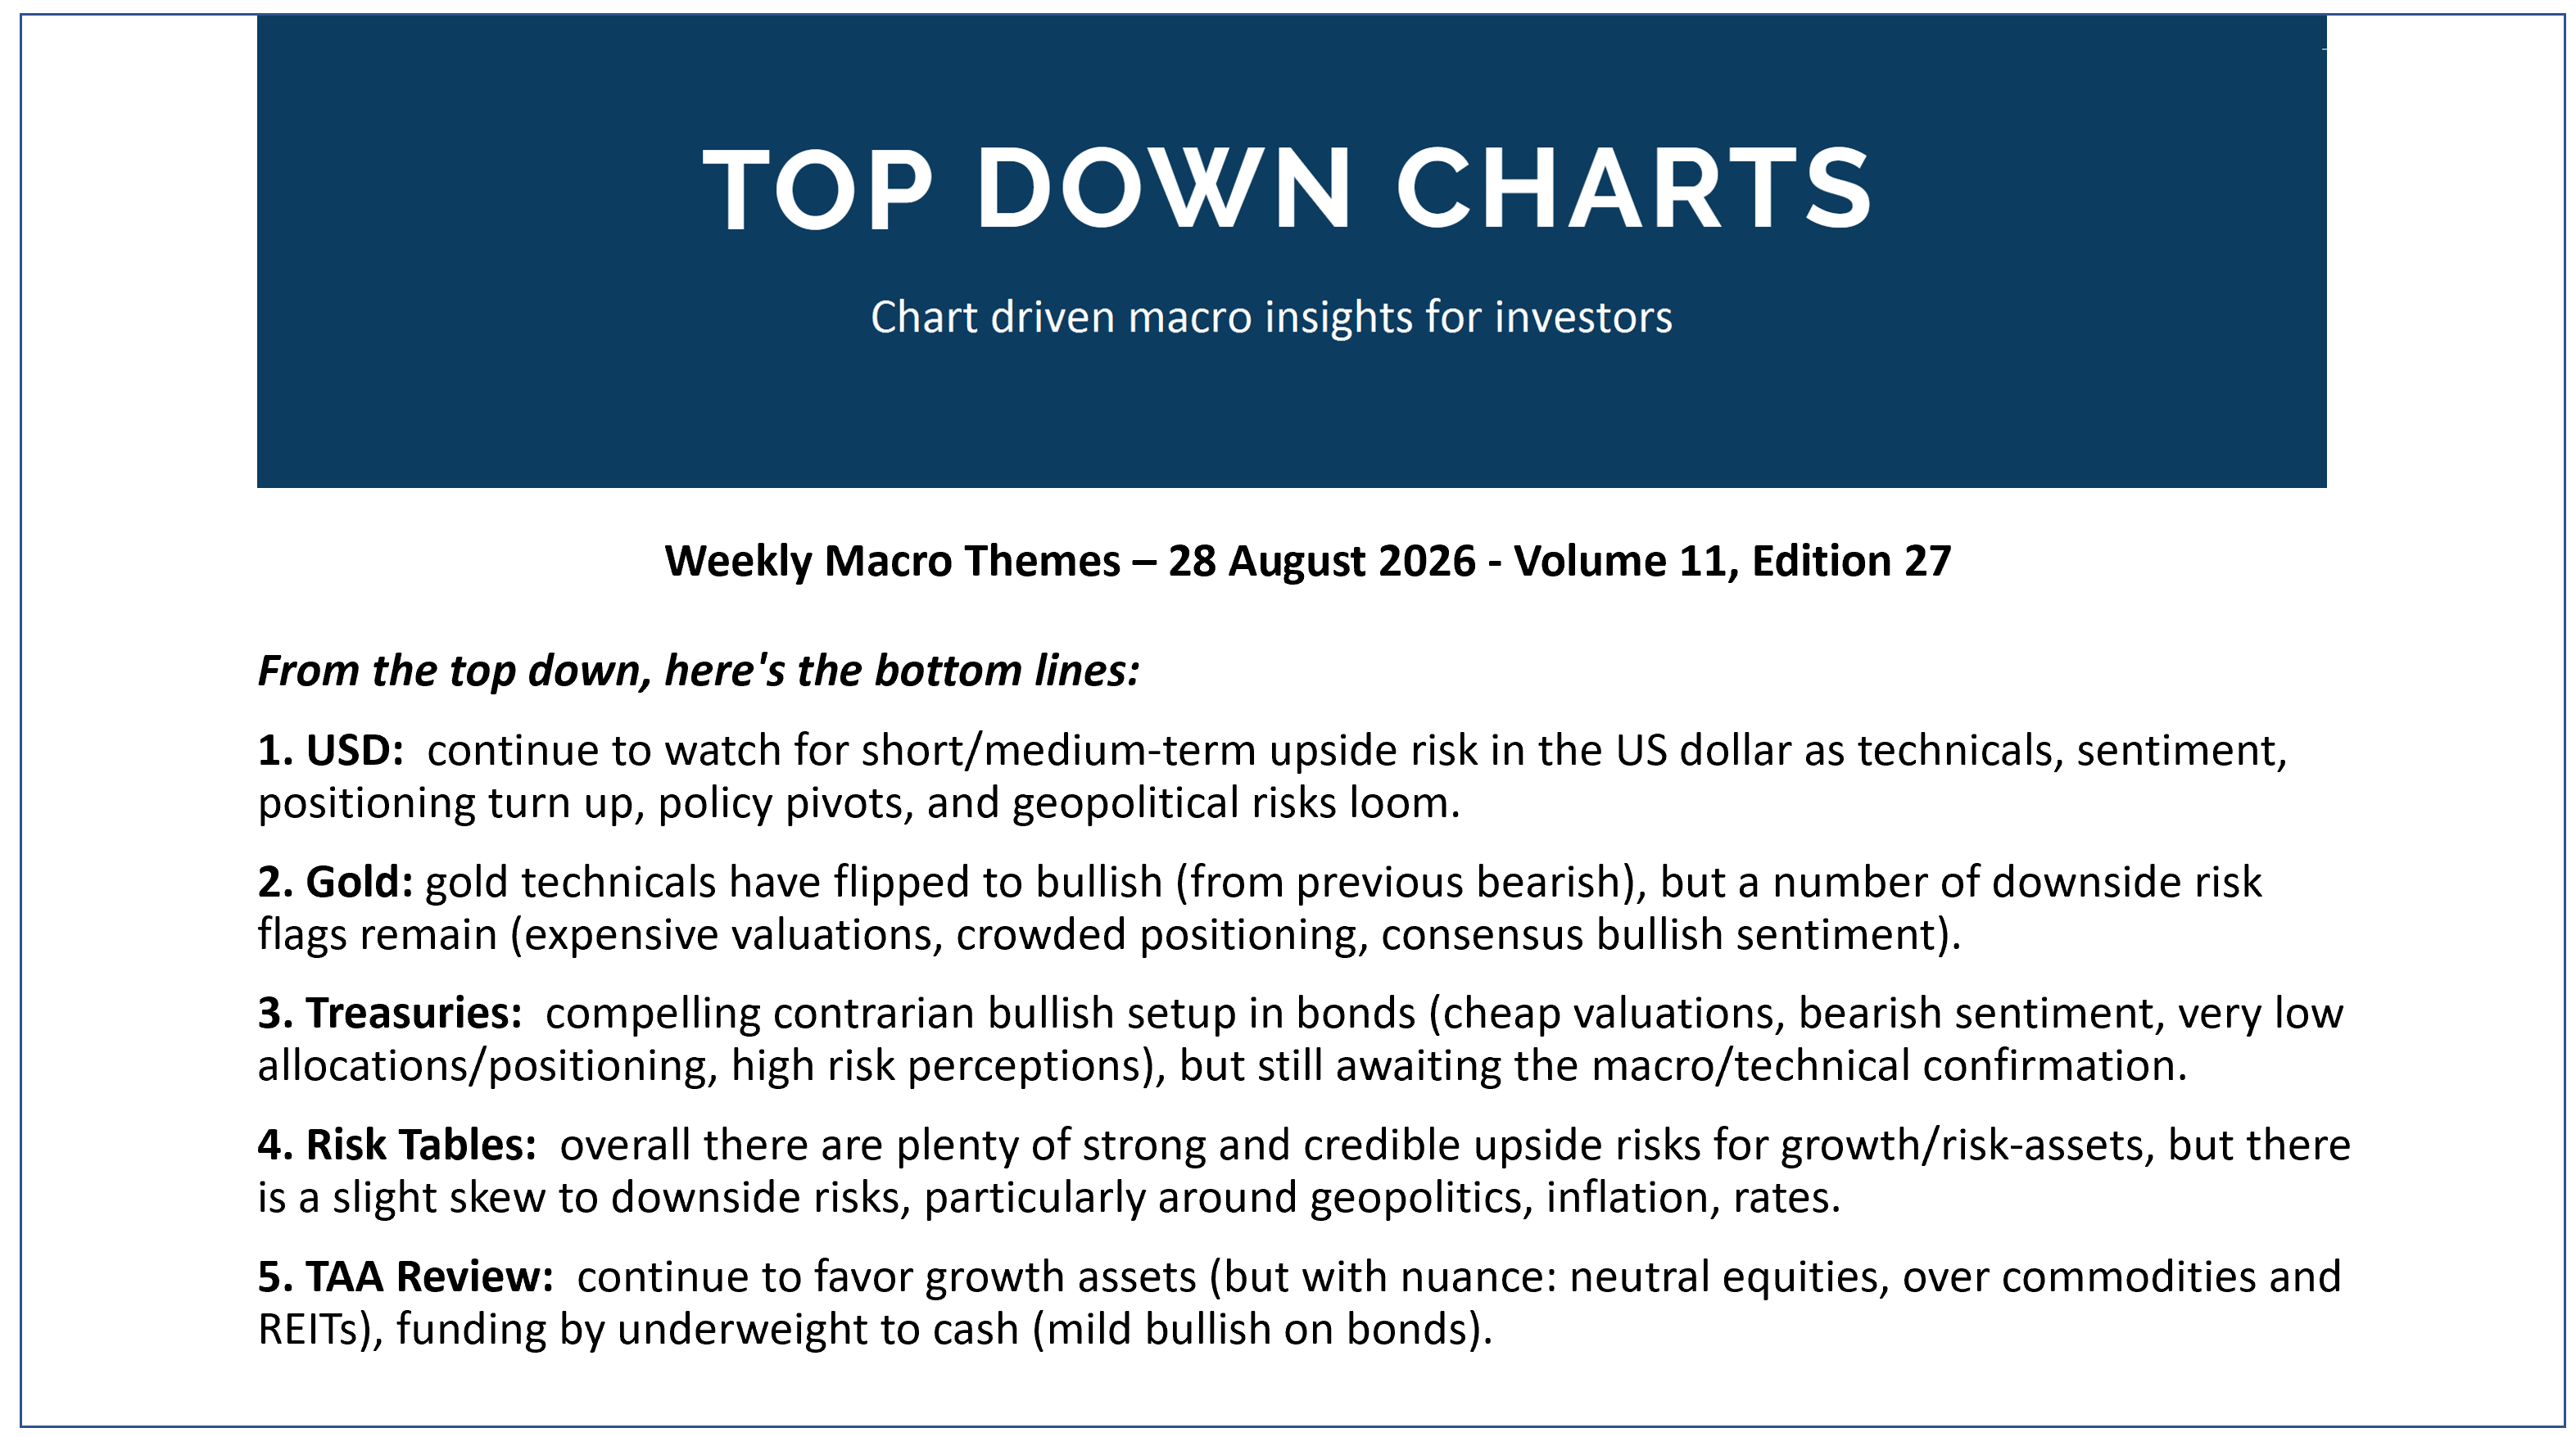
Here’s the topics & takeaways from my latest report —it should give a good sense of what I tend to cover in the Topdown Pro service as well as providing some high-level insights into how I am currently seeing Macro & Markets:
1. USD: continue to watch for short/medium-term upside risk in the US dollar as technicals, sentiment, positioning turn up, policy pivots, and geopolitical risks loom.
2. Gold: gold technicals have flipped to bullish (from previous bearish), but a number of downside risk flags remain (expensive valuations, crowded positioning, consensus bullish sentiment).
3. Treasuries: compelling contrarian bullish setup in bonds (cheap valuations, bearish sentiment, very low allocations/positioning, high risk perceptions), but still awaiting the macro/technical confirmation.
4. Risk Tables: overall there are plenty of strong and credible upside risks for growth/risk-assets, but there is a slight skew to downside risks, particularly around geopolitics, inflation, rates.
5. TAA Review: continue to favor growth assets (but with nuance: neutral equities, over commodities and REITs), funding by underweight to cash (mild bullish on bonds).
Thanks for reading! Reply to this email if you have any questions.
—
Best wishes,
Callum Thomas
Head of Research at Topdown Charts
Connect: LinkedIn | Twitter/X | Substack
p.s. What do you reckon?
Please provide feedback below (reply by email if you had any specific points)
Also, in case you missed it: be sure to check out the previous note — in this post you will find more macro market musings + a key chart on Stocks vs Bonds [and last week’s survey results!!]
![[Chart] Stocks vs Bonds](https://substackcdn.com/image/fetch/$s_!04pD!,w_1300,h_650,c_fill,f_webp,q_auto:good,fl_progressive:steep,g_auto/https%3A%2F%2Fsubstack-post-media.s3.amazonaws.com%2Fpublic%2Fimages%2F22c45cce-1531-4f39-b3ab-261d93019a73_1200x910.png)
Learn more about Topdown Charts —> this post explains what Topdown Charts does + The Topdown Charts Framework for monitoring macro & markets to consistently generate profitable ideas:

Topdown Charts Research Digest — Archives
Click through for more free updates and insights from Topdown Charts:
Thanks for reading, learn more: about Topdown Charts