

Note: this is a new series for free subscribers and is intended to give an insight into the work that goes on at Topdown Charts (+deliver some useful and timely takeaways).
Chart in Focus: Tailwinds Turning
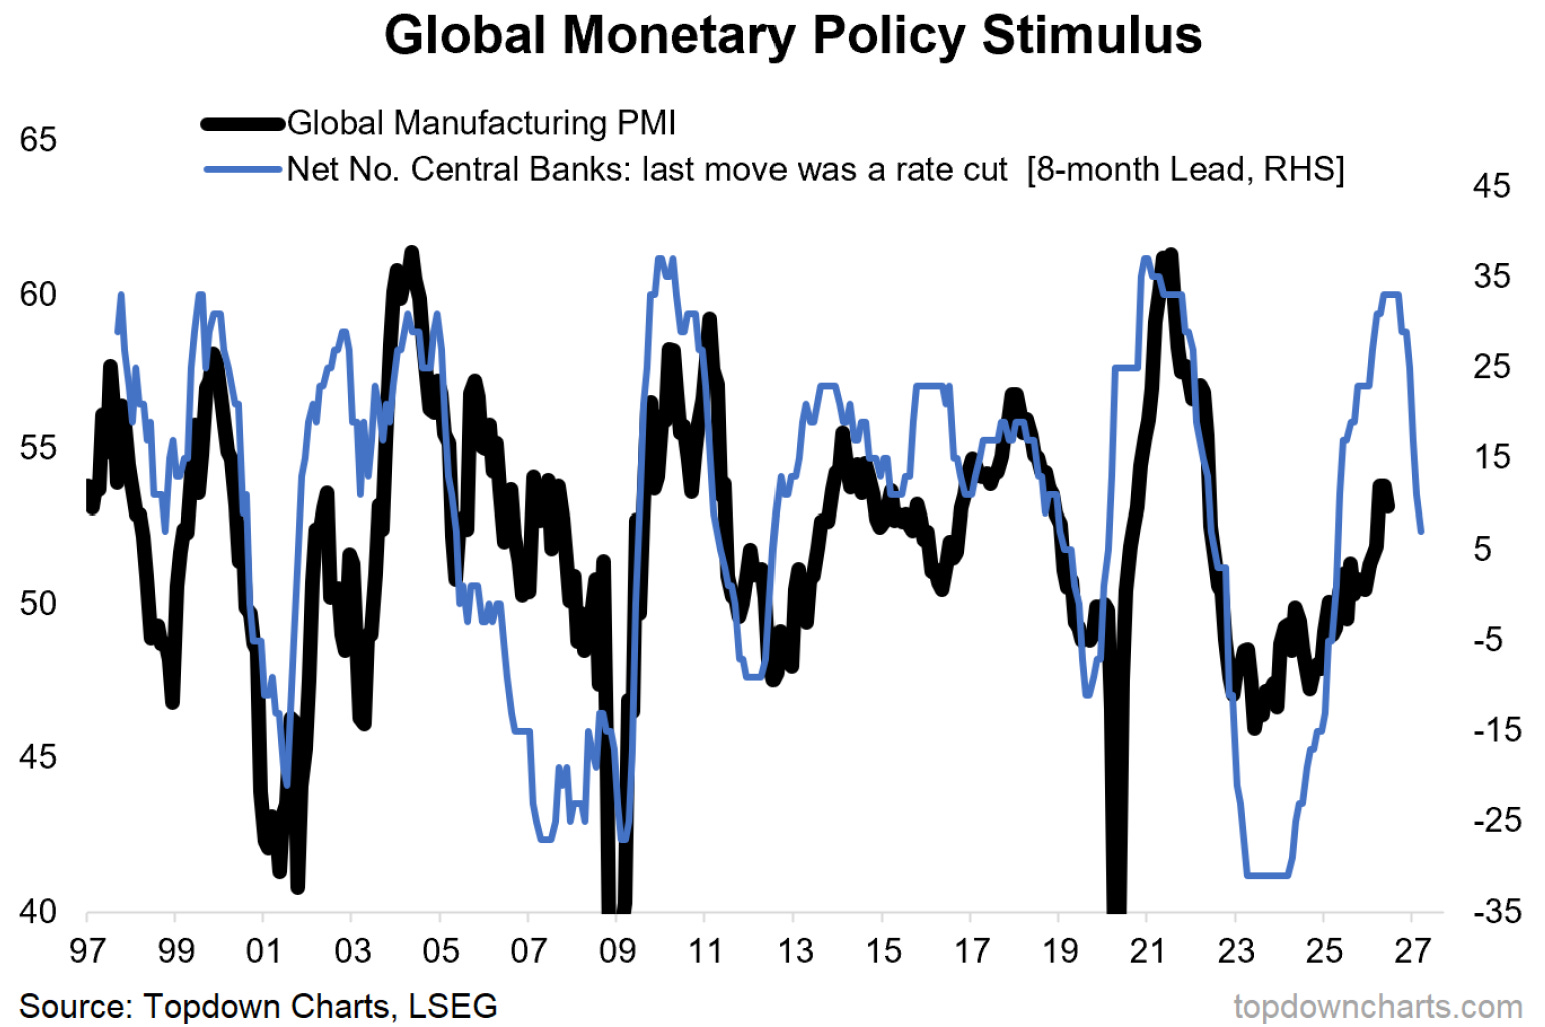
The global economy has been riding the tailwinds from successive waves of monetary policy easing —and this has been a key factor behind the reacceleration we’ve seen this year (despite all that’s been going on in the world).
But now those tailwinds are beginning to turn as central banks pivot back to rate hikes.
With lingering upside risks to inflation, we’re likely to see more and more central banks pivot to rate hikes. So we’re going to be heading into 2027 with a distinctly different macro picture to that seen in 2026 as tailwinds turn to headwinds.
Global Growth Outlook 2027 — What do you think?
(what do you think is the most likely path for global growth heading into 2027?)
Weekly Report Highlights
Here’s the topics & takeaways from my latest report —it should give a good sense of what I tend to cover in the Topdown Pro service as well as providing some high-level insights into how I am currently seeing Macro & Markets:
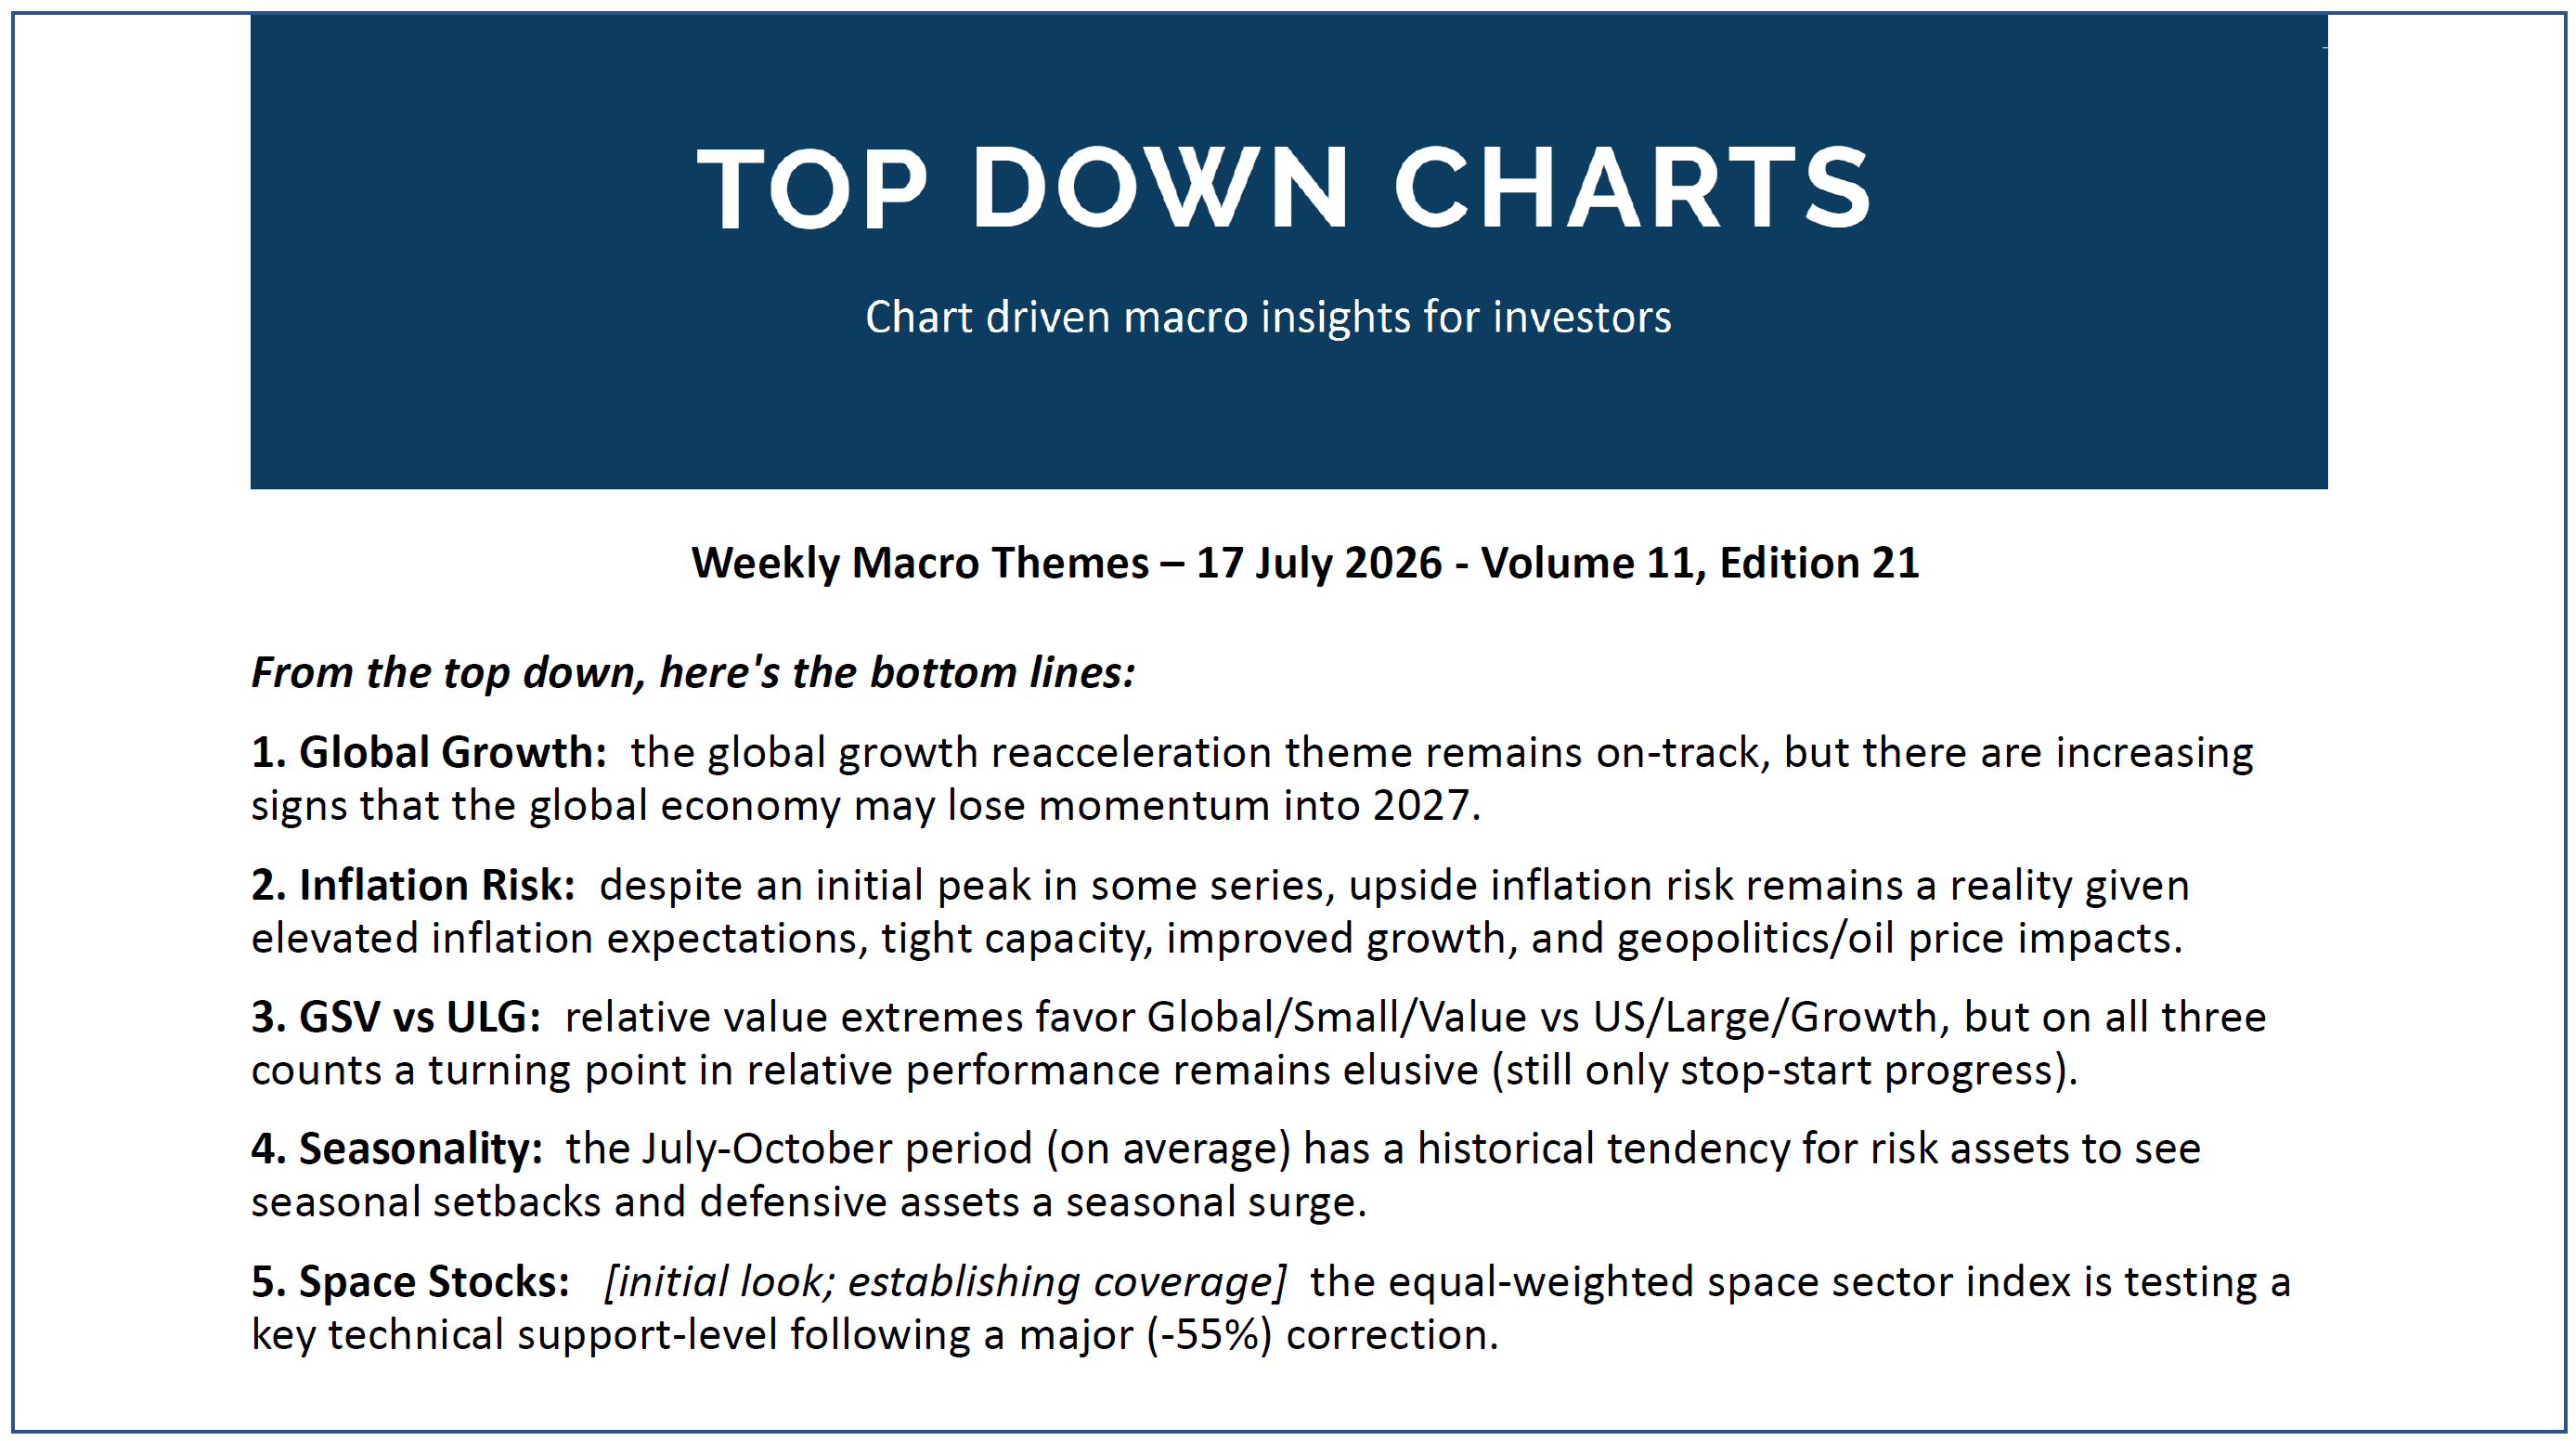
1. Global Growth: the global growth reacceleration theme remains on-track, but there are increasing signs that the global economy may lose momentum into 2027.
2. Inflation Risk: despite an initial peak in some series, upside inflation risk remains a reality given elevated inflation expectations, tight capacity, improved growth, and geopolitics/oil price impacts.
3. GSV vs ULG: relative value extremes favor Global/Small/Value vs US/Large/Growth, but on all three counts a turning point in relative performance remains elusive (still only stop-start progress).
4. Seasonality: the July-October period (on average) has a historical tendency for risk assets to see seasonal setbacks and defensive assets a seasonal surge.
5. Space Stocks: [initial look; establishing coverage] the equal-weighted space stock index is testing a key technical support-level following a major (-55%) correction.
Thanks for reading! Please feel welcome to share/forward this note :-)
+reply to this email if you have any questions.
—
Best wishes,
Callum Thomas
Founder & Head of Research at Topdown Charts
LinkedIn: https://www.linkedin.com/in/callum-thomas-4990063/
Twitter/X: https://twitter.com/Callum_Thomas
p.s. What did you think of this note?
(you can reply to me by email if you had any specific feedback or questions)
Also, in case you missed it: be sure to check out the previous note — in this note you will find more macro market musings + a key chart on software stocks [and last week’s survey results!!]
![[Chart] sunset or silver-lining?](https://substackcdn.com/image/fetch/$s_!ChXF!,w_1300,h_650,c_fill,f_webp,q_auto:good,fl_progressive:steep,g_auto/https%3A%2F%2Fsubstack-post-media.s3.amazonaws.com%2Fpublic%2Fimages%2F05beaddc-a1b0-42dd-9a1a-625f9bcd4a20_1752x1385.png)
Learn more about Topdown Charts —> this post explains what Topdown Charts does + The Topdown Charts Framework for monitoring macro & markets to consistently generate profitable ideas:

.