

Note: this is a new series for free subscribers to give an insight into the work that goes on at Topdown Charts (+deliver some useful and timely takeaways).
Chart: Global Economic Pulse Check
Two key macro charts this week.
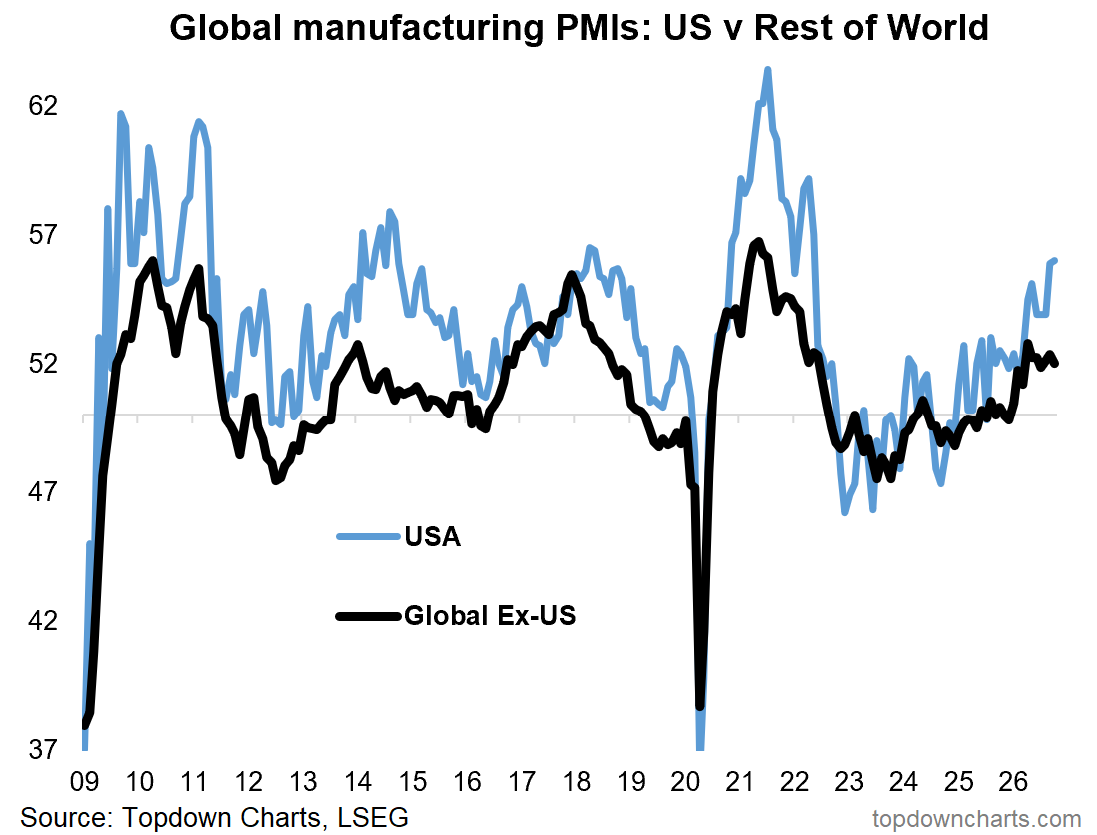
First one below shows the US PMI accelerating in 2026 and pulling away from the pack (with rest-of-world having peaked back in April).
But it also shows a repeating pattern of global rolling over first, US going it alone for a while (like it is again now) but then ultimately catching down to the rest of the world into slowdown and recession-run-in. So it is a bit of a mixed-messages chart; level-wise and previous direction of travel it looks good, but the divergence and softening of global ex-US looks familiar for the wrong reasons.
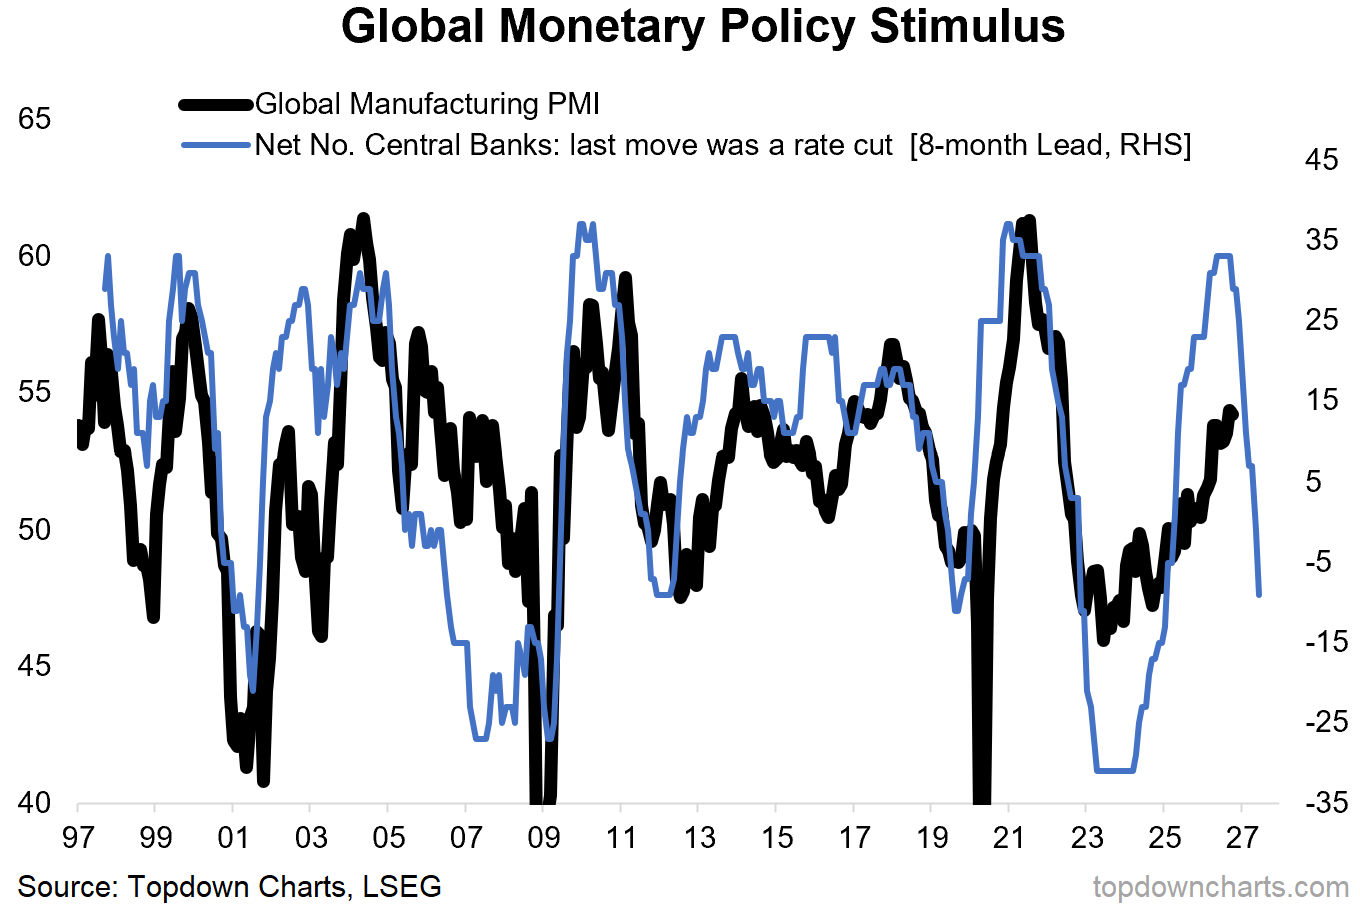
The second chart further below also looks familiar for the wrong reasons, with the global policy pivot from previous waves of rate cuts to now increasingly rate hikes and monetary tightening pointing the way to a global growth slowdown in 2027.
This is why one of the key risks in my downside risks table is a global growth scare — and this is something I am going to be keeping close tabs on (along with markets/asset allocation implications).
Global Growth Outlook 2027 — What do you think?
(what do you think is the most likely path for global growth heading into 2027?)
Bonus Chart: as previously noted, the monetary tides are turning. The global policy pivot of 2026 has seen a huge transition from over 90% of central banks in rate cut mode late last year, to now over 60% of central banks in rate hike mode.
This pivot is already making its weight felt through macro and markets, with the BOK pivot to rate hikes arguably among the catalysts triggering off weakness in the KOSPI, and Fed hikes arguably contributing to the stagnation in US tech stocks (and volatility in US treasuries).
Maybe there will be offsetting factors, maybe growth merely tapers-off, maybe we don’t see a slowdown or recession. But charts like this are important in that they provide an evidence-based prompt to consider pathways and scenarios that could have significant implications for investors. That’s why I count this as one of the key macro charts in my top-down tool-kit (and it has helped me successfully make a number of key macro + asset allocation calls over the past decade).
Weekly Report Notes
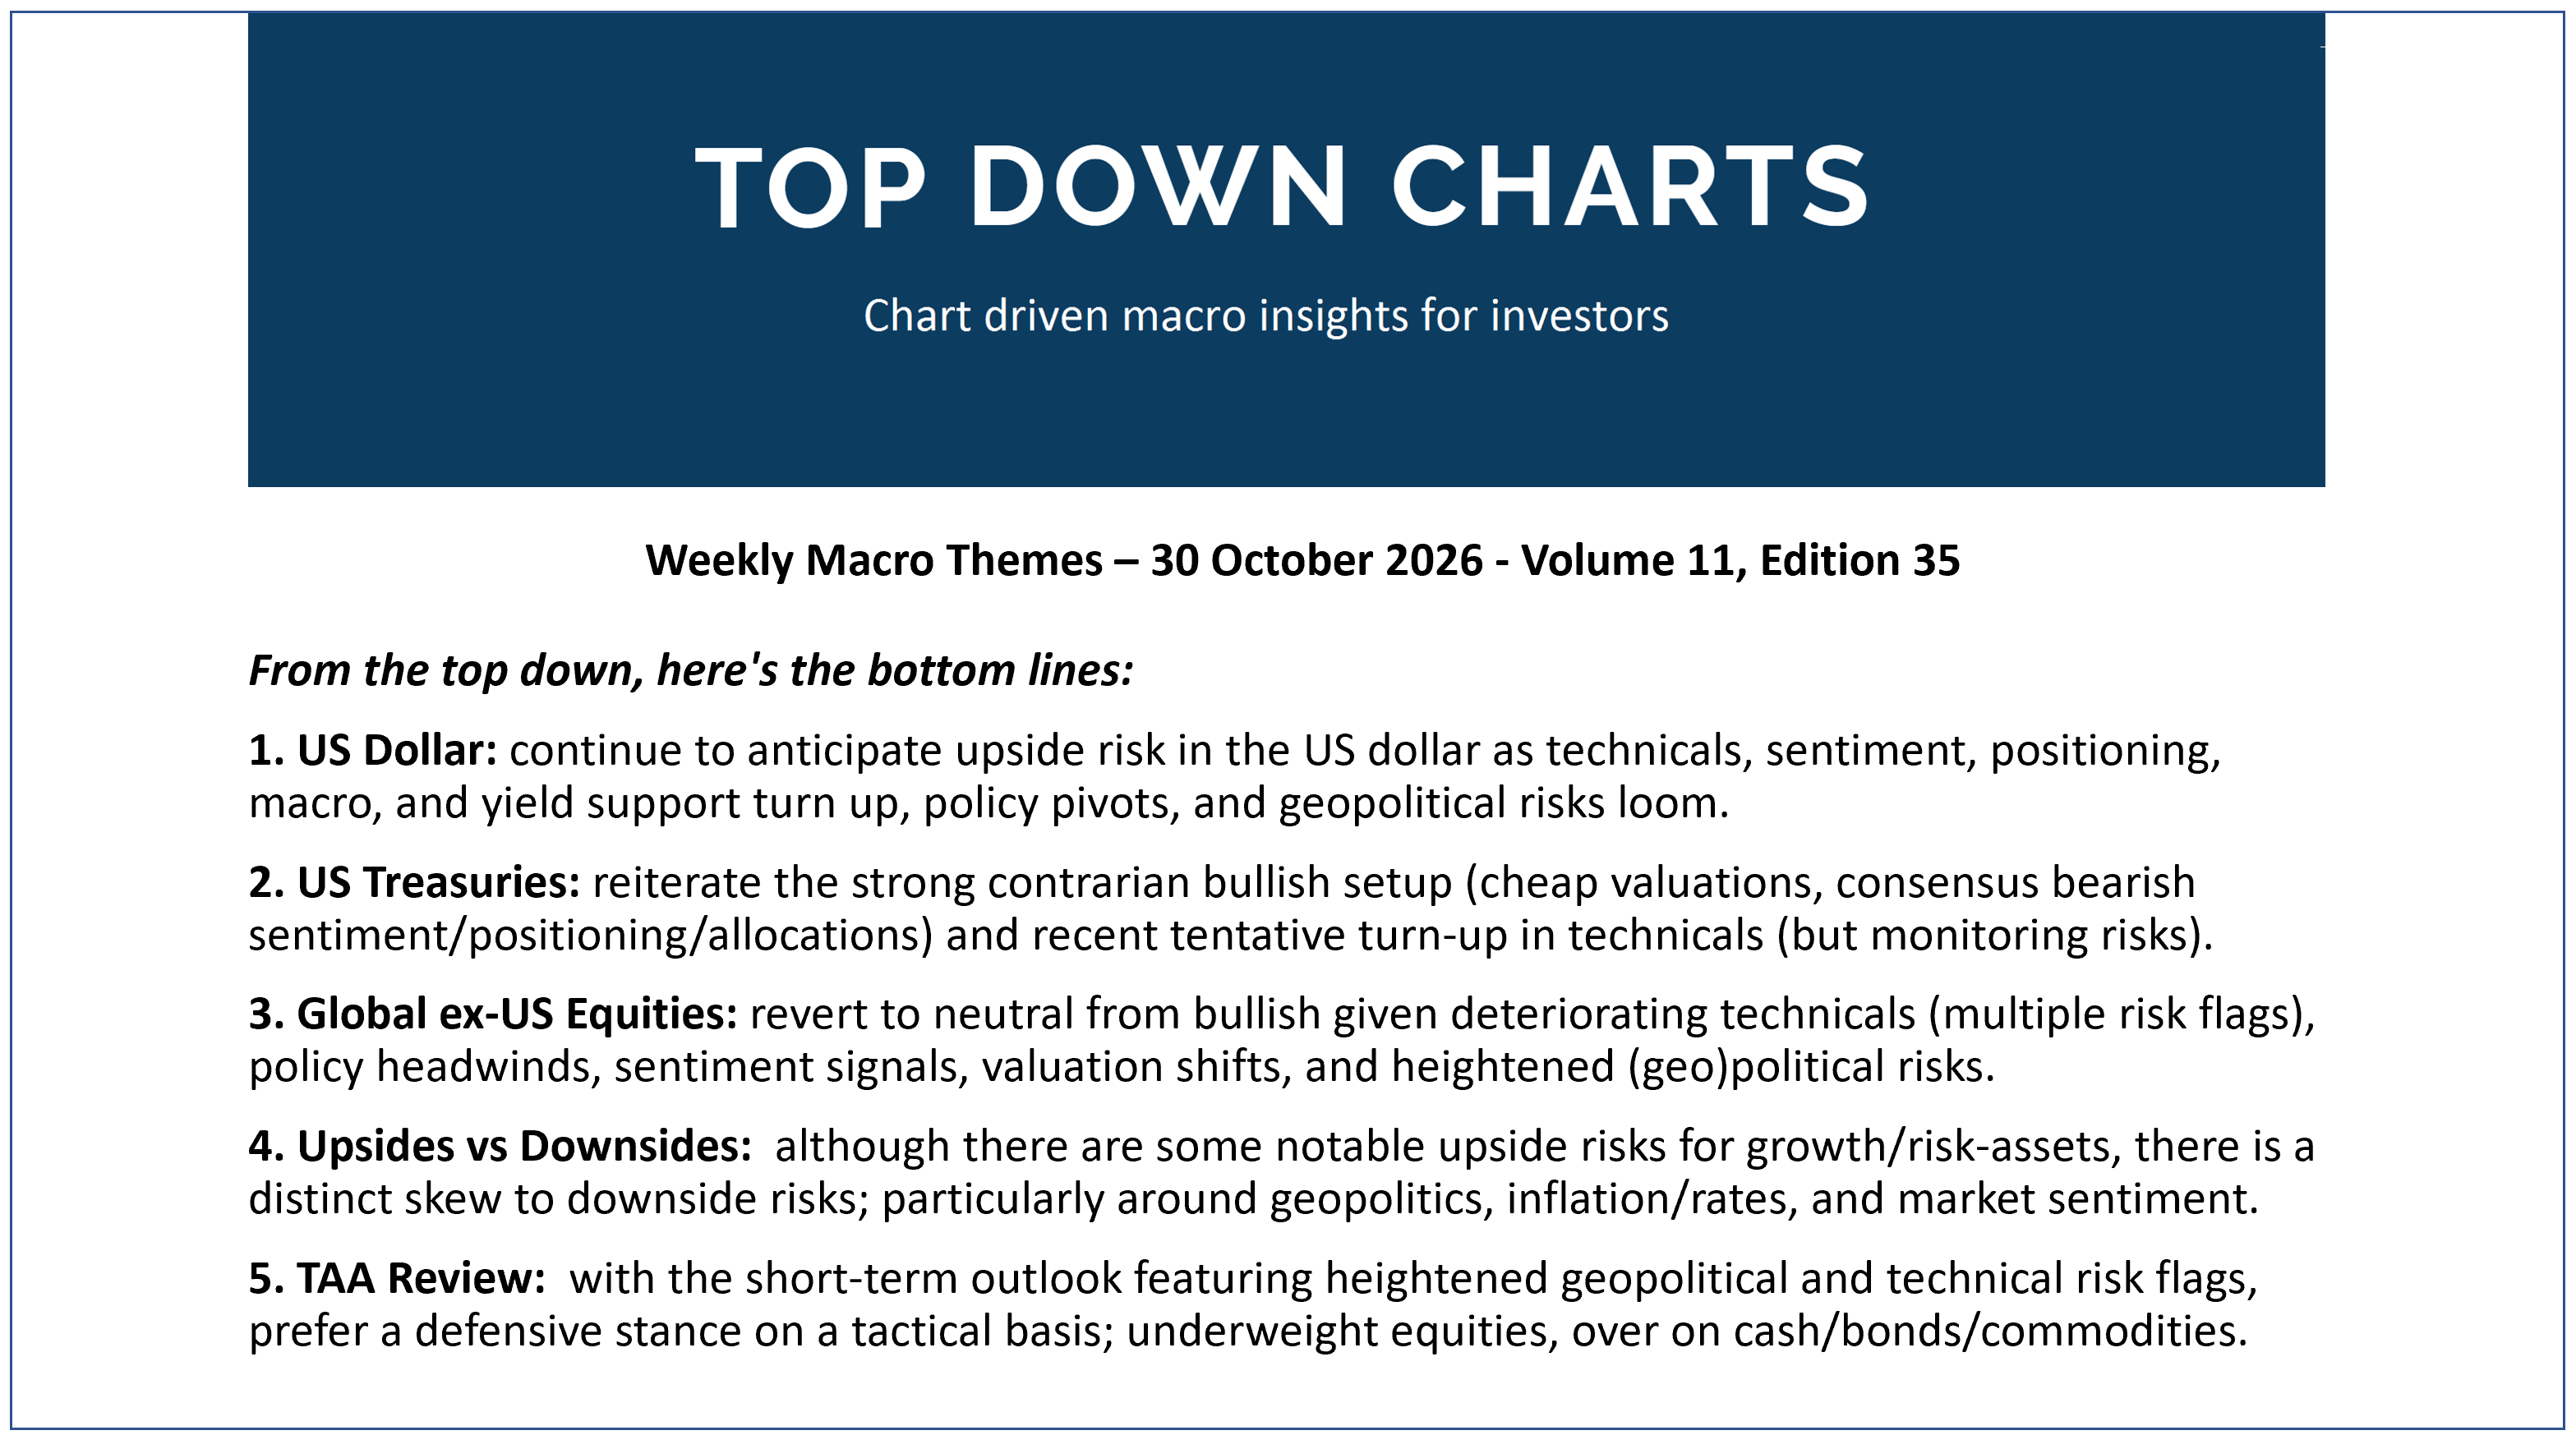
Here’s the topics & takeaways from my latest report —it should give a good sense of what I tend to cover in the Topdown Pro service as well as providing some high-level insights into how I am currently seeing Macro & Markets:
1. US Dollar: continue to anticipate upside risk in the US dollar as technicals, sentiment, positioning, macro, and yield support turn up, policy pivots, and geopolitical risks loom.
2. US Treasuries: reiterate the strong contrarian bullish setup (cheap valuations, consensus bearish sentiment/positioning/allocations) and recent tentative turn-up in technicals (but monitoring risks).
3. Global ex-US Equities: revert to neutral from bullish given deteriorating technicals (multiple risk flags), policy headwinds, sentiment signals, valuation shifts, and heightened (geo)political risks.
4. Upsides vs Downsides: although there are some notable upside risks for growth/risk-assets, there is a distinct skew to downside risks; particularly around geopolitics, inflation/rates, and market sentiment.
5. TAA Review: with the short-term outlook featuring heightened geopolitical and technical risk flags, prefer a defensive stance on a tactical basis; underweight equities, over on cash/bonds/commodities.
Thanks for reading! Reply to this email if you have any questions.
—
Best wishes,
Callum Thomas
Head of Research at Topdown Charts
p.s. What do you reckon?
Please provide feedback below (reply by email if you had any specific points)
Also, in case you missed it: be sure to check out the previous note — in this post you will find more macro market musings + a key chart on US Semiconductor stocks [and last week’s survey results!!]

Learn more about Topdown Charts —> this post explains what Topdown Charts does + The Topdown Charts Framework for monitoring macro & markets to consistently generate profitable ideas:
