
Click the links below to read frequently asked questions and answers about the Topdown Charts Professional service.
What is the Topdown Charts Professional service?
Topdown Charts provides global multi-asset investors with:
Ideas (which assets/markets offer the highest conviction reward vs risk, what ideas are working now, what ideas will work soon) —[where to invest]
Risk alerts (what are the near and pressing tactical risks for investors, what are the risks lurking over the horizon) —[what to watch out for]
Macro insights (what’s happening in the global economy, what’s coming next, and how does this specifically impact risk/return for investors) —[big picture]
The Purpose = Help investors Make Better Decisions with Confidence.
Clients receive the regular Weekly Macro Themes report + Quarterly Strategy Pack (along with webinars + Q&A sessions). The reports aim to make the research side of investing easier by delivering chart-driven; easy-to-read, clear, and concise ideas —with a track record of excellence over the past decade.
Topdown Charts was founded in 2016 by Callum Thomas after leaving his job as multi-asset investment strategist at a large fund management company.
His goal was to create a research product that would be chart-focused (highly visual, light on words, heavy on impact), pragmatic (merging fundamentals + macro + technicals to build a comprehensive picture and raise conviction), and highly useful (something worth reading, something that is actually helpful for portfolio managers and investors; and ultimately something that helps measurably boosts investment performance).
Over the past decade, Callum has established Topdown Charts as a reliable, innovative, and effective research partner. Clients include hedge funds, family offices, wealth advisors, and some of the world’s largest fund managers.
Most importantly, he has established an excellent track record, identifying several major macro-market shifts + a strong hit rate of 70%+ on investment ideas. Along with that, client feedback has been consistently excellent, and the renewal rate among our institutional client base is close to 90%.
What’s the philosophy and angle behind Topdown Charts?
The core philosophy is that macro and markets go in cycles, and that these cycles more or less rhyme across time, assets, markets, and geographies.
The conceptual model of the market cycle is displayed below — and this version is probably a bit more nuanced than what you might be used to seeing, because we understand the psychological turmoil, constraints, and governance pressures that each stage of the cycle brings.
Topdown Charts helps investors navigate these cycles.

Specifically, by studying history and developing the right indicator set, we have proven over time that you can spot opportunities that others often miss, and steer clear of predictable risks.
In the Weekly Macro Themes report we provide the conceptual and analytical framework + specific recommendations to give investors the confidence and certainty to make the good decisions in uncertain times.
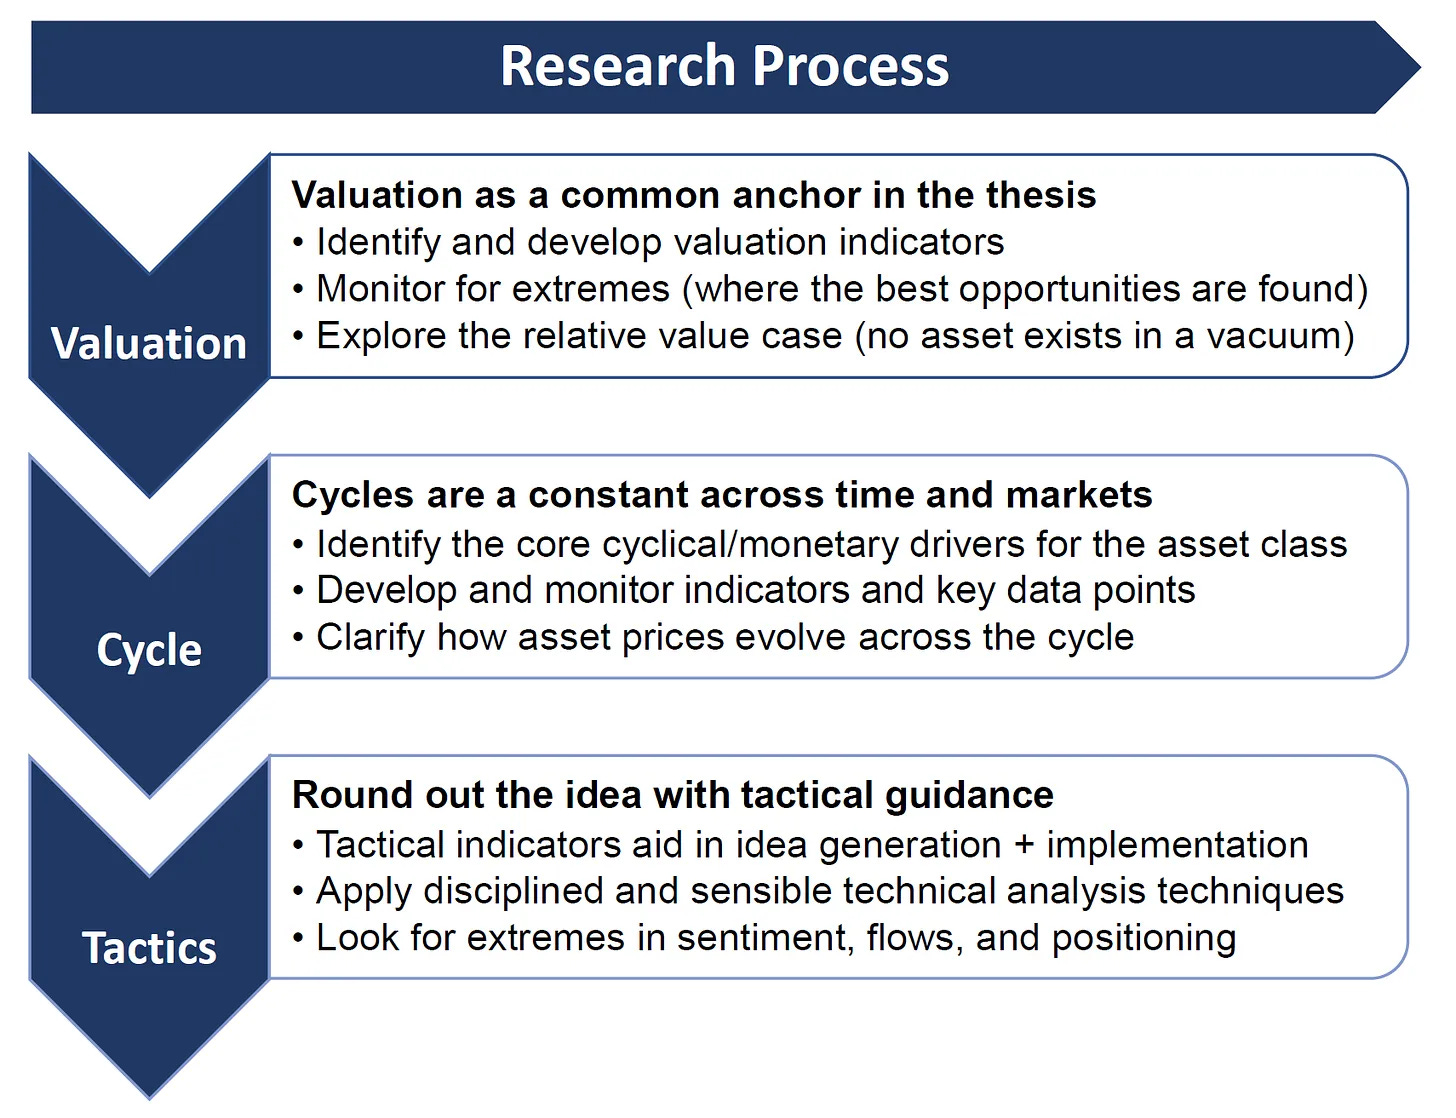
It is this pragmatic top-down approach that has helped us (and our clients) achieve repeatable performance across asset classes & market cycles.
And ultimately, that is the core objective — to achieve repeatable performance (i.e. ideas that boost portfolio returns and/or help protect capital), over the long-run, across cycles and markets.
We are not here to make a quick buck.
This is not get-rich quick.
We are here for the long haul.
We are here to deliver the maximum number of excellent ideas and useful insights over the long-term, because that’s how we can have the biggest impact in helping our clients (and their clients) get ahead.
What assets and markets do you cover?
The mandate of this service is Global Multi-Asset Investing.
This is going to be most relevant to people who are comfortable taking a global perspective and considering sectors, regions, assets, and markets that may be off the radar for many other investors (or outside of their usual focus).
It also means the kind of people who want to stay informed on key global macro developments and get visibility on risks + opportunities across major markets, specific sectors and regions (e.g. stock pickers who want the top-down perspective).
But also asset allocators who want the big picture asset allocation view (such as tactical asset allocation guidance [actively adjusting portfolio weights across the cycle]), and high conviction views on the major asset classes.
The below table provides an overview of the scope of the service — i.e. what we aim to deliver, and across what markets/assets. But in general there is no constraint on what we can cover, it is just a matter of where the biggest risks are coming from, and where the best opportunities are hiding…
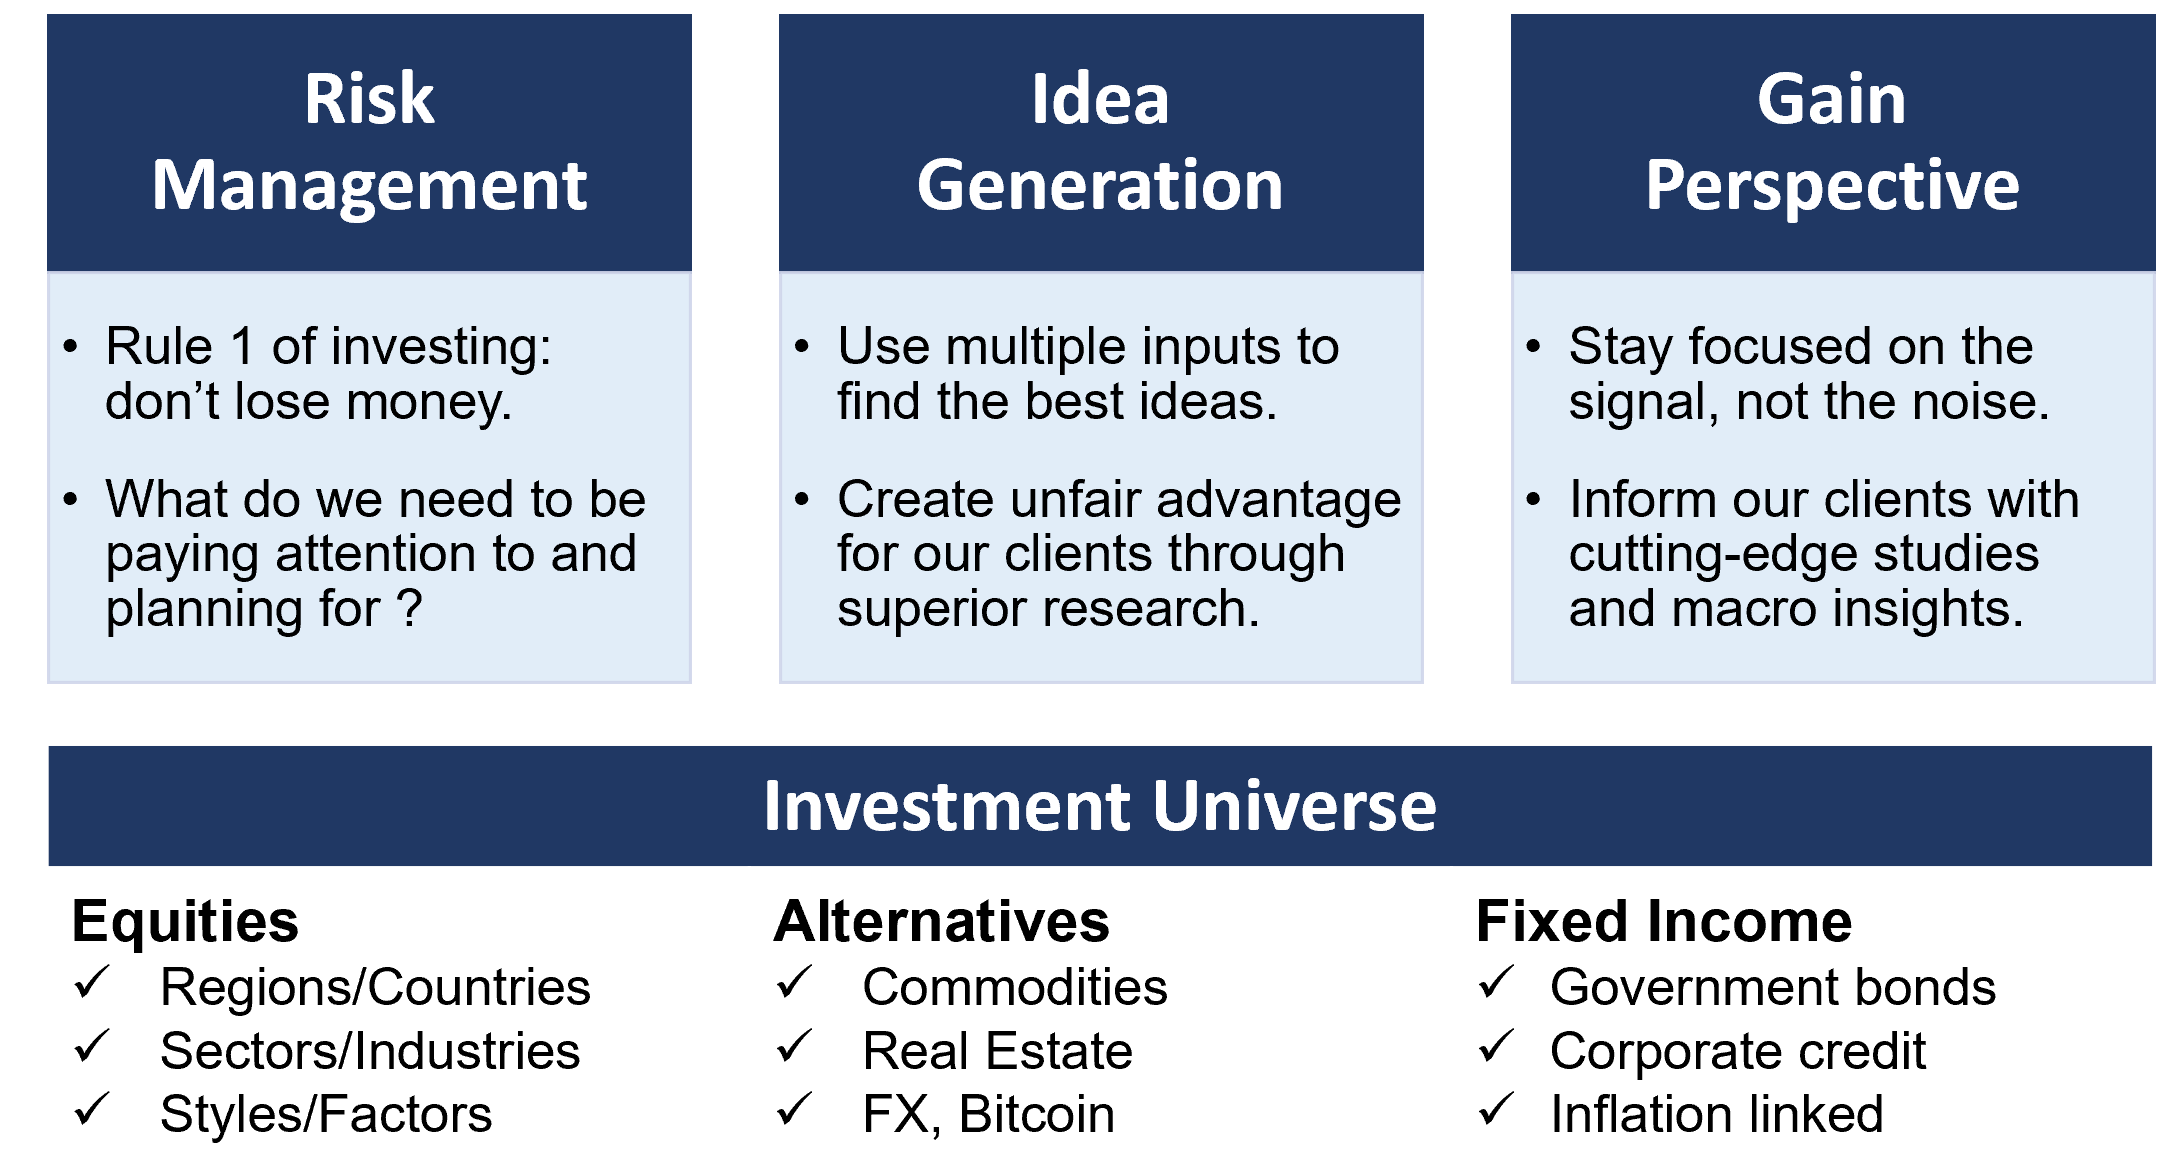
To summarize, Topdown Charts is focused on providing Global Multi-Asset Investors with risk management input (alerts on short-term + bigger picture risks for investors), idea generation (what assets/markets to prioritize to optimize portfolio returns), and perspective building (market studies, insights on key investment-relevant macro trends, thought pieces with real investment implications).
And we have established a strong track record for excellence in delivering this to a loyal and sophisticated client base over more than a decade.
Can I see a Specific Example of an Idea from Start-to-Finish?
Yes, in addition to details on our Track Record, you can find 3 worked examples below (including the original reports).
I have included 3 examples below: 2 ideas that worked well, and 1 that resulted in a loss — so that you can see how coverage of new ideas work as well as updates to those ideas as conditions change and the conclusion of the idea lifecycle.
Example 1: Bullish EM Equities 2023-26 [+94%]
The example below shows the successful identification of upside opportunity for Emerging Market Equities. The original reports, charts, and reasoning can be viewed below.
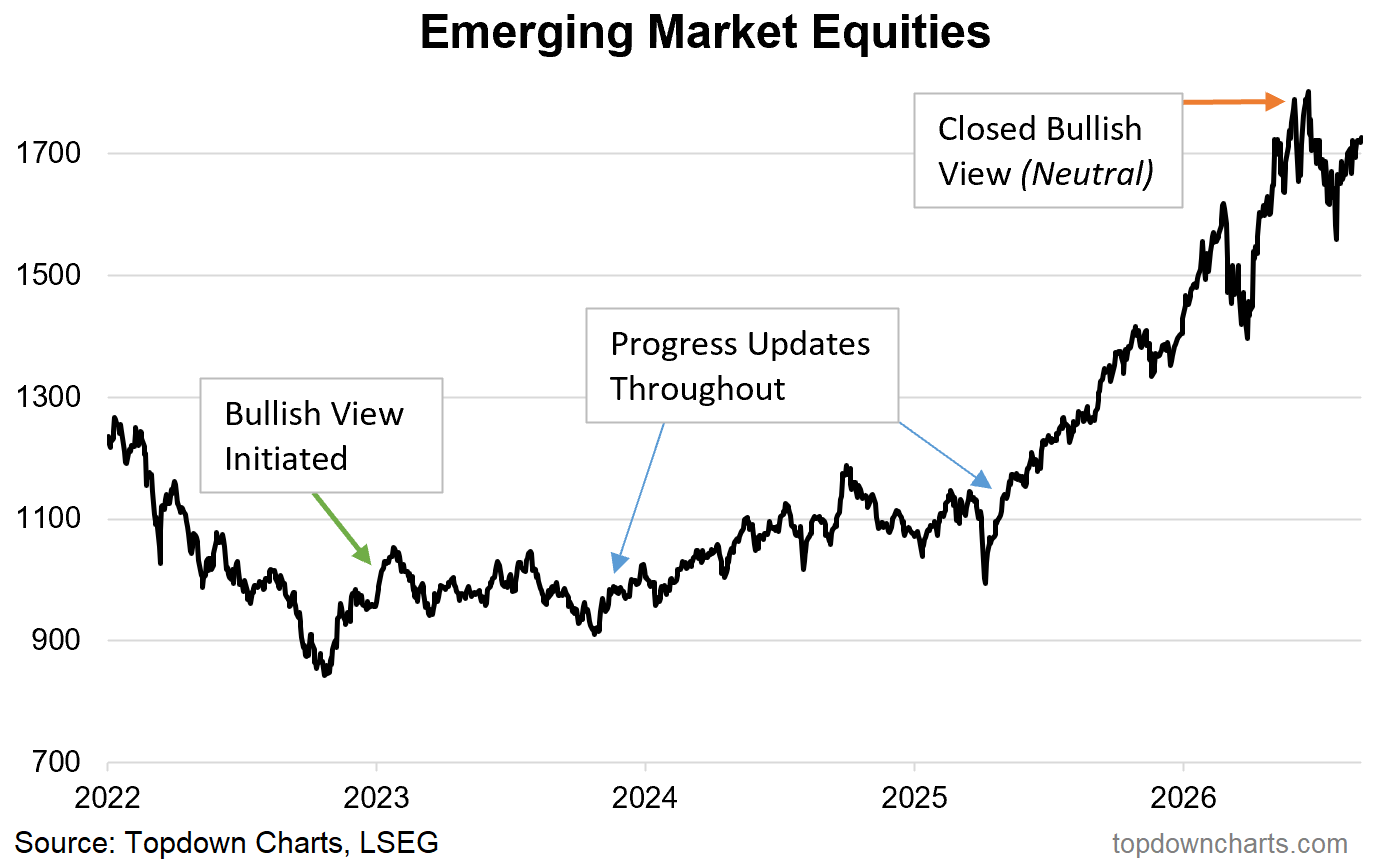
You can review the original reports from each of those milestones on the chart here (overall conclusion excerpted):
[Established Bullish View] 20 Jan 2023 “Bullish EM equities given cheap valuations, light allocations, an apparent end to the bear market, turn in monetary conditions, contrarian bullish signals, and much improved technicals.”
[Progress Update] 10 November 2023 “Bullish EM equities as a prospective inflection point comes against a backdrop of a turn in monetary conditions, capitulating sentiment, and cheap valuations.”
[Progress Update] 9 May 2025 “Remain bullish EM equities on strengthening technicals, reset in sentiment/flows, cheap valuations, and light allocations by investors (+turning point in relative performance).”
[Closed Position] 5 June 2026 “[retain a] longer-term bullish bias, but switching to neutral for now given downside risks arising from the shift in valuations/sentiment, policy pivot, and short-term overheating (Korea/AI bubble).”
This provides a good insight into how the ideas are put together in the first place + some of the updates along the way (n.b. live ideas are typically updated every 20-45 days depending on what’s going on e.g. sometimes more frequently, sometimes less frequently).
Updating the ideas is an important part of the service — because often times the bigger question isn’t simply “buy or sell?“, but “do we stay the course?“ (+what are the key indicators and variables we need to keep tracking to understand the outlook and risks). The visibility is the value.
Example 2: Bullish Commodities 2020-22 [+122%]
The example below shows the successful identification of the upside opportunity for Commodities (which also worked very well in 2022 as a hedge against downside risk in stocks and bonds). The original reports, charts, and reasoning can be viewed below.
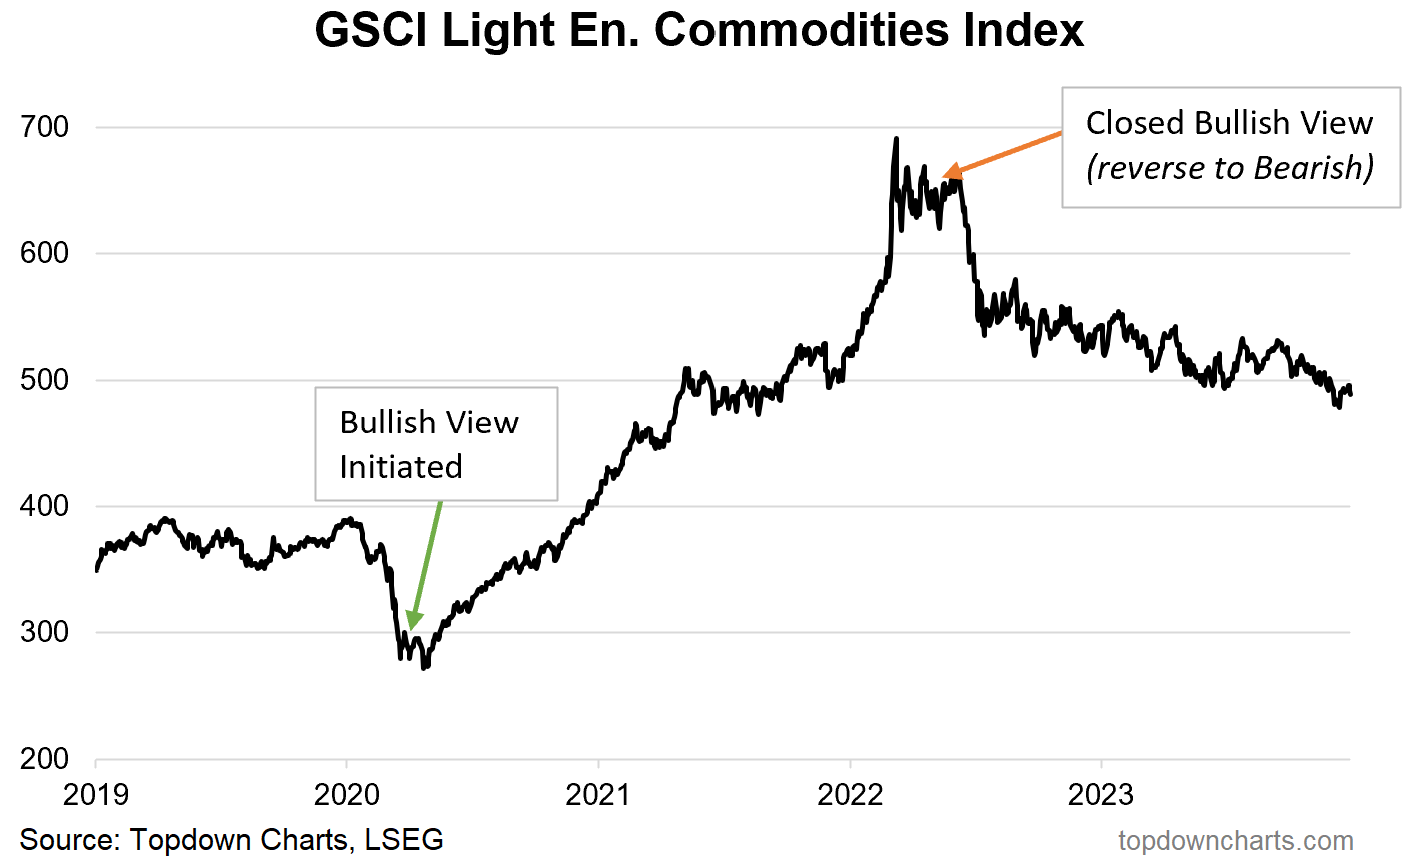
The Original Reports can be found below (i.e. idea initiation and conclusion, which in this case also resulted in switching from bullish to outright bearish).
[Established Bullish View] 20 March 2020 “Bullish medium-term on cheap valuations, supportive capex/supply outlook, and the ZLTEI [Zero Long-Term Economic Impairment (from the pandemic)] thesis. Meanwhile short-term/tactical indicators have moved sharply (to contrarian bullish).”
[Reversed to Bearish View] 13 May 2022 “Time to turn bearish on commodities as technicals, intermarkets, sentiment/positioning, macro outlook, value, and initial supply response means risks are now weighted to the downside.”
Notably, this was one of the few calls that worked well for investors in 2022 as stocks and bonds lost, and only cash and commodities turned in positive returns. My process really pulled through in 2021/22, and was a lone voice in some of these key calls.
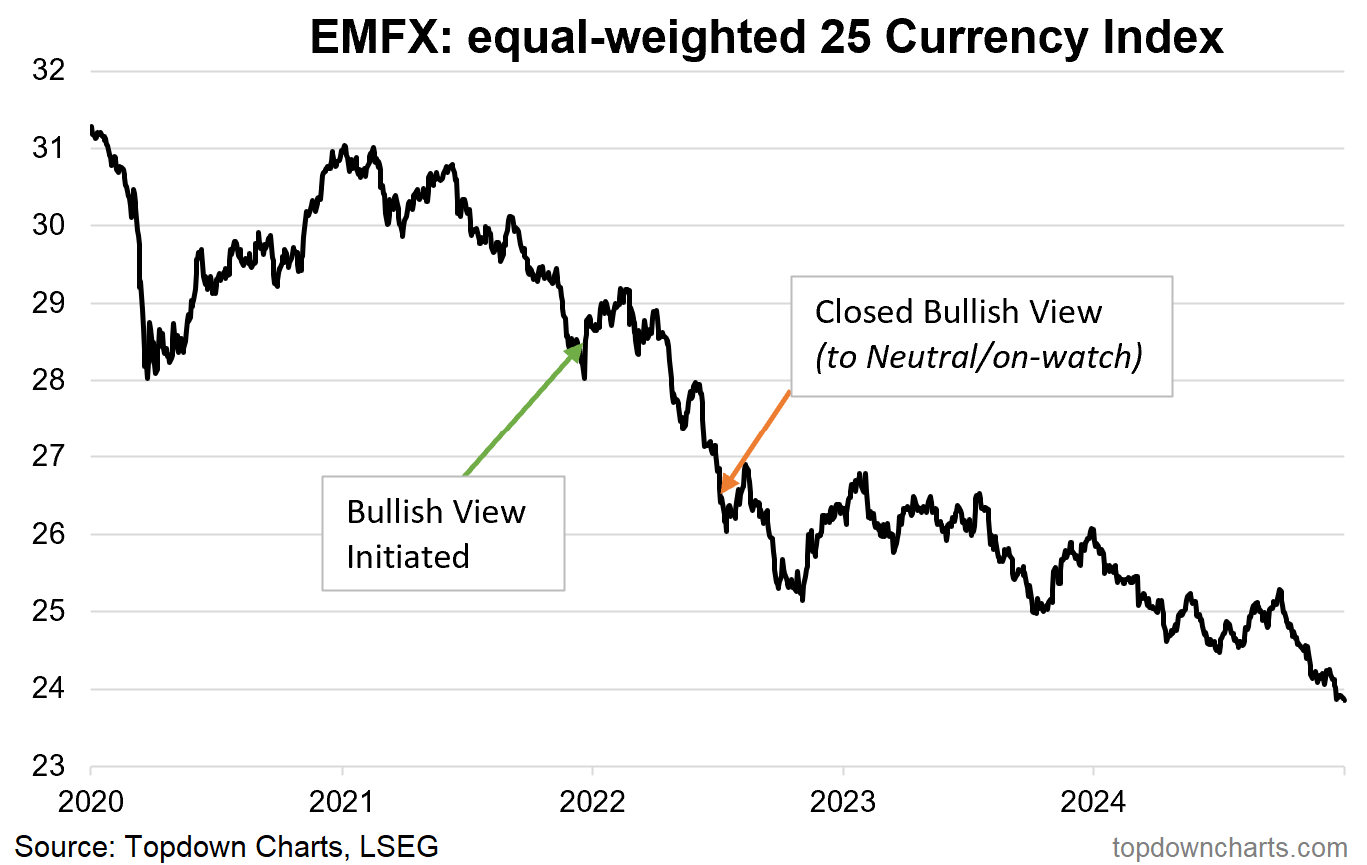
Example 3: Bullish EMFX in 2022 [-9%]
This was one of those situations where the initial setup looked compelling, but the facts changed on a number of fronts, and hence it was better to close the view and change to neutral/on-watch than keep digging in and staying with a losing position.
The Original Reports can be found below:
[Established Bullish View] 21 January 2022 “Bullish EMFX on cheap valuations, supportive macro, and much improved technicals.”
[Closed Position] 8 July 2022 “Although the valuation picture is very compelling, the array of concerning intermarket signals and clear bearish momentum means best to revert back to neutral pending better entry (and macro/sentiment/intermarket confirmation).”
As you can see in the reports, the initial logic behind the idea was sound and made sense at the time based on where the evidence was (improved technicals, cheap valuations, commodity tailwinds, weak USD outlook), but later in the process it became clear that the evidence had shifted to no longer support a bullish view (and if anything highlighted the downside risks ahead, and as you can see in the chart it was better to take the loss and change my view as the facts changed rather than dig in and ride it all the way down).
Do you have a Model Asset Allocation/Portfolio?
I do not publish a model portfolio or benchmark strategic asset allocation, the reason is because I'm not comfortable providing what would essentially be a one-size-fits-all portfolio. My client base is too diverse to do that (different goals, countries, tax considerations, governance pressures/constraints, market access, risk profile, etc) —instead my preference is to focus on idea generation and asset class views, and leave it to clients to manage the portfolio construction aspect.
(which also touches on specialization: I'm focused on being an excellent researcher rather than a portfolio manager as well)
We do provide a monthly Tactical Asset Allocation review. This is designed to give systematic and regular guidance on the outlook for the major asset classes to help investors proactively shape their portfolios and asset mix.
The below example is from April 2026, it shows the overall assessment, risks and catalysts, and whether each of the 5 Factors favor growth vs defense at the high-level. But the main feature is the tilts table — dark blue indicates overweight, dark grey indicates underweight (and middle grey is neutral).
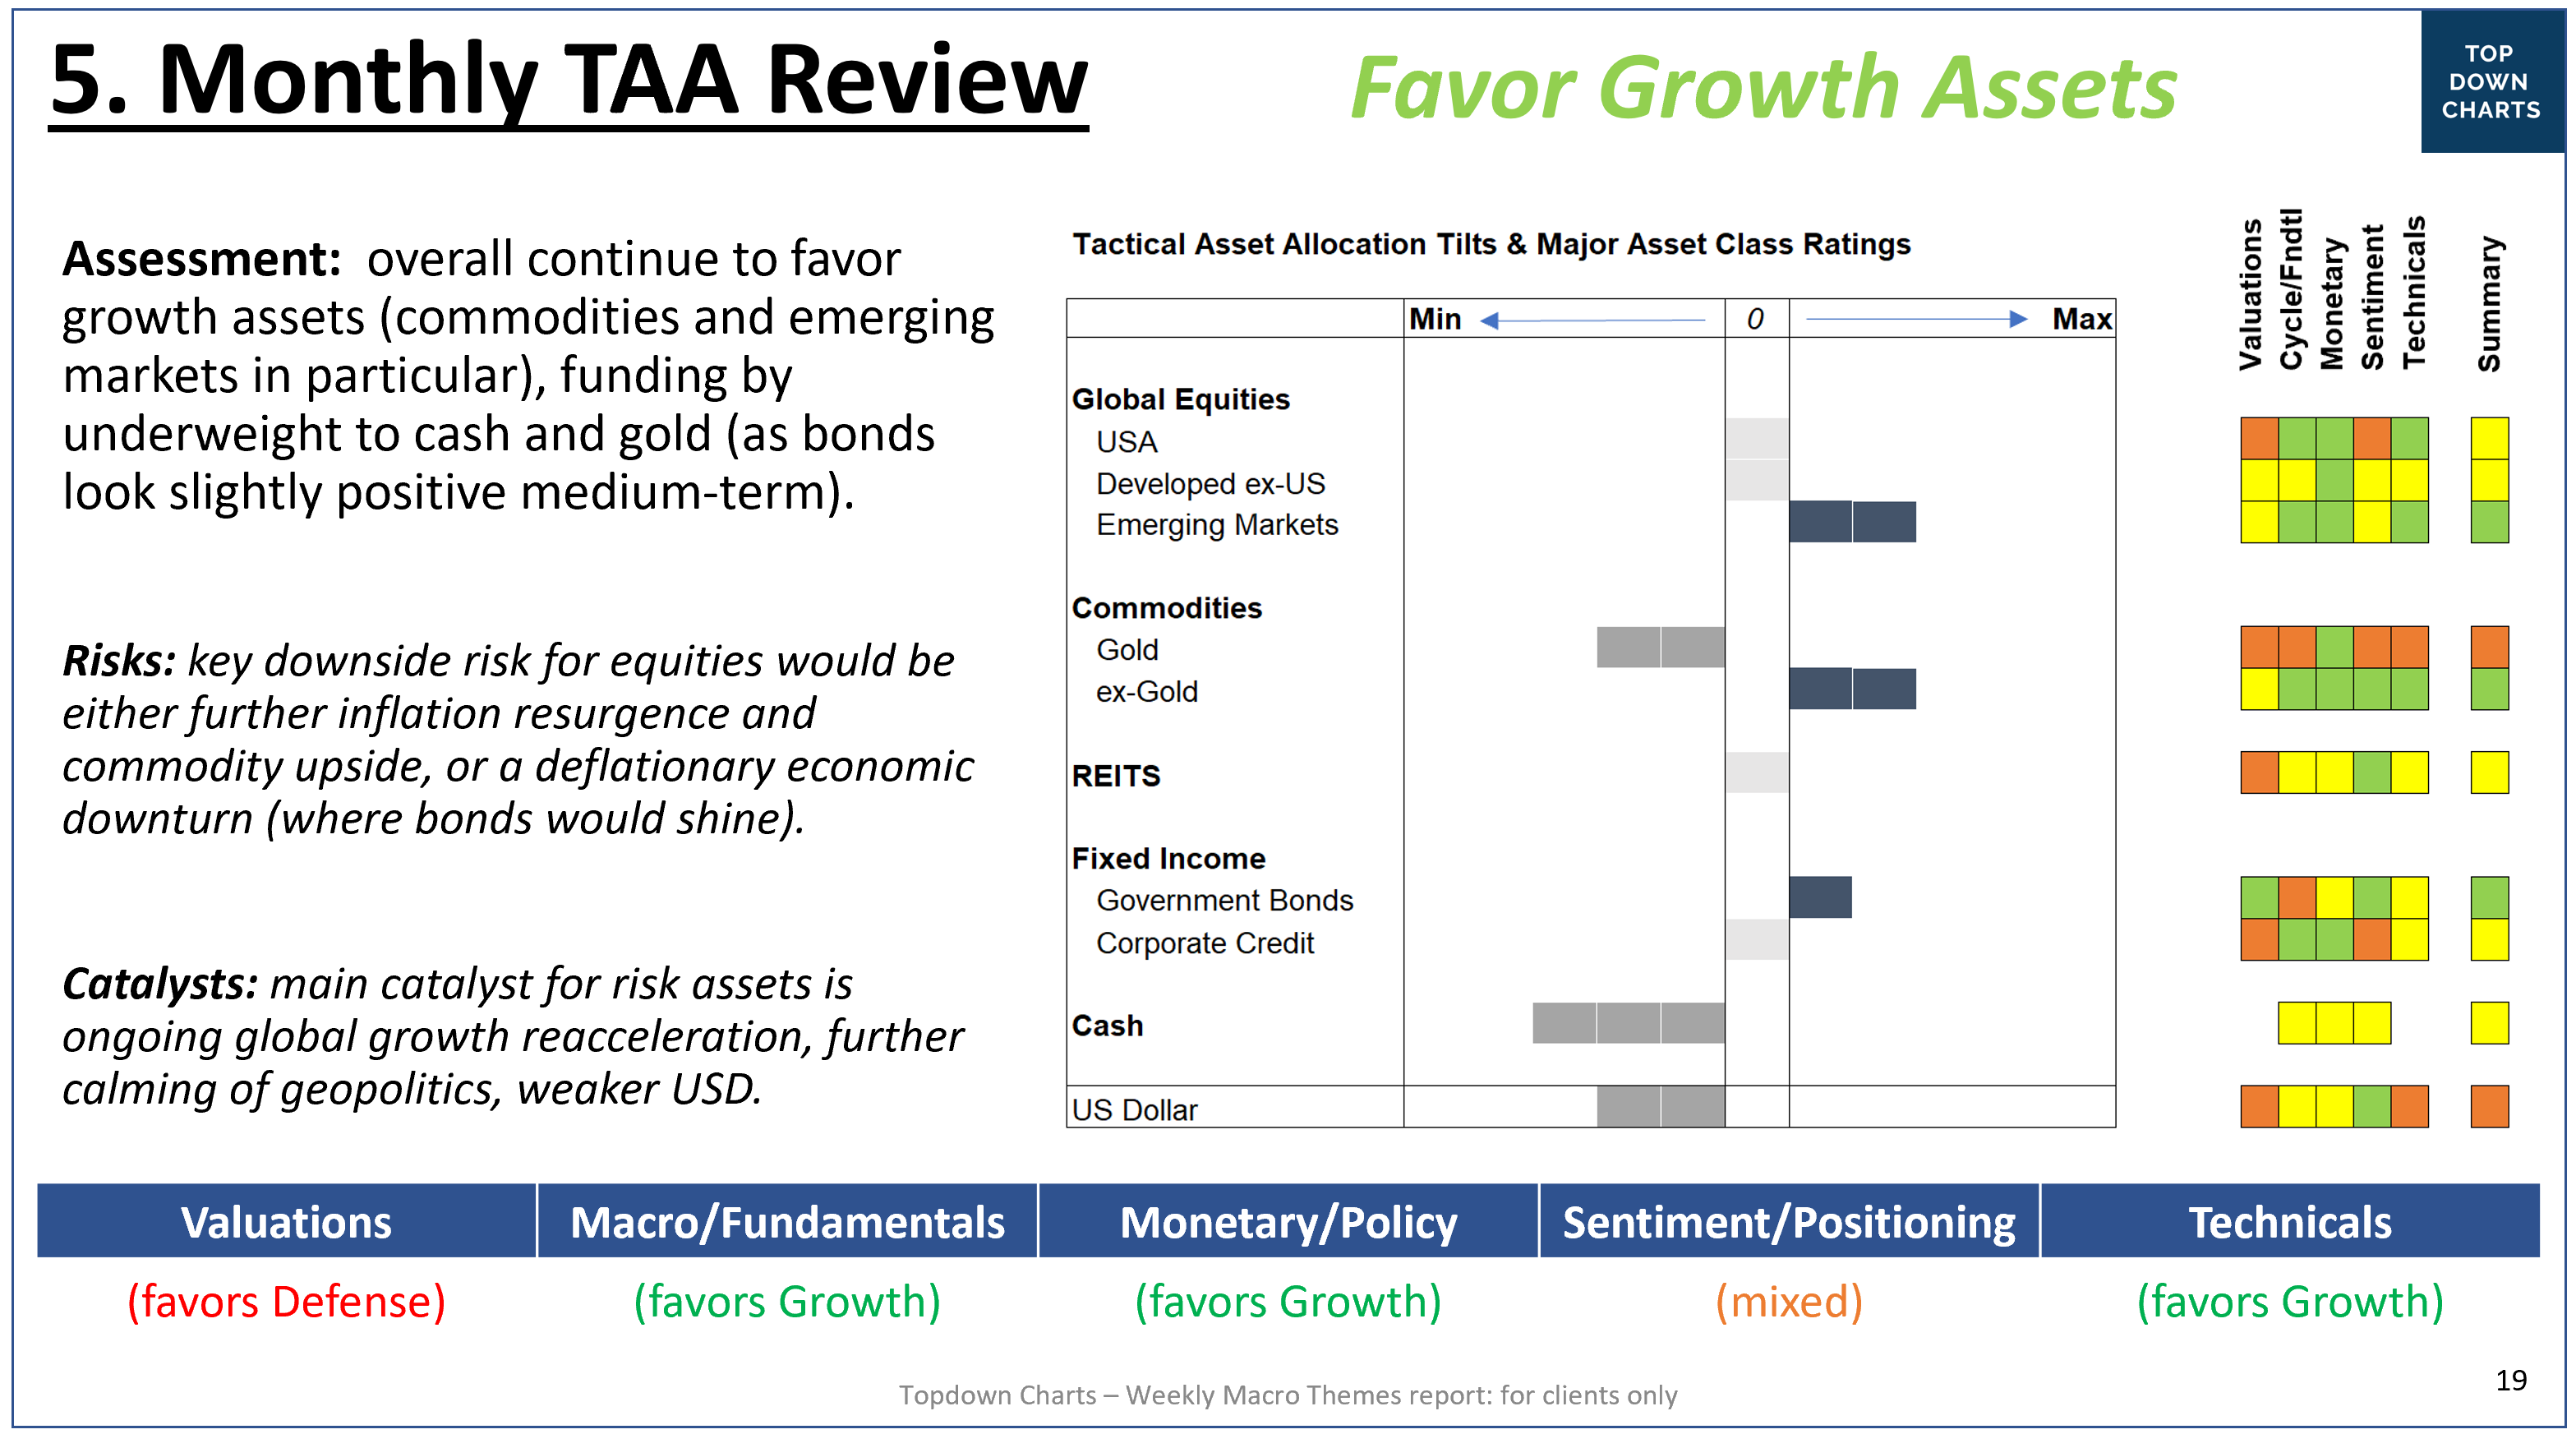
The asset class ratings on the side also help explain the tilts + outlook for each asset class. Orange is unfavorable, yellow is neutral/mixed, and green is favorable. The summary is the overall view. These ratings are based on quantitative inputs, data, and charts, but are filled in based on my judgements.
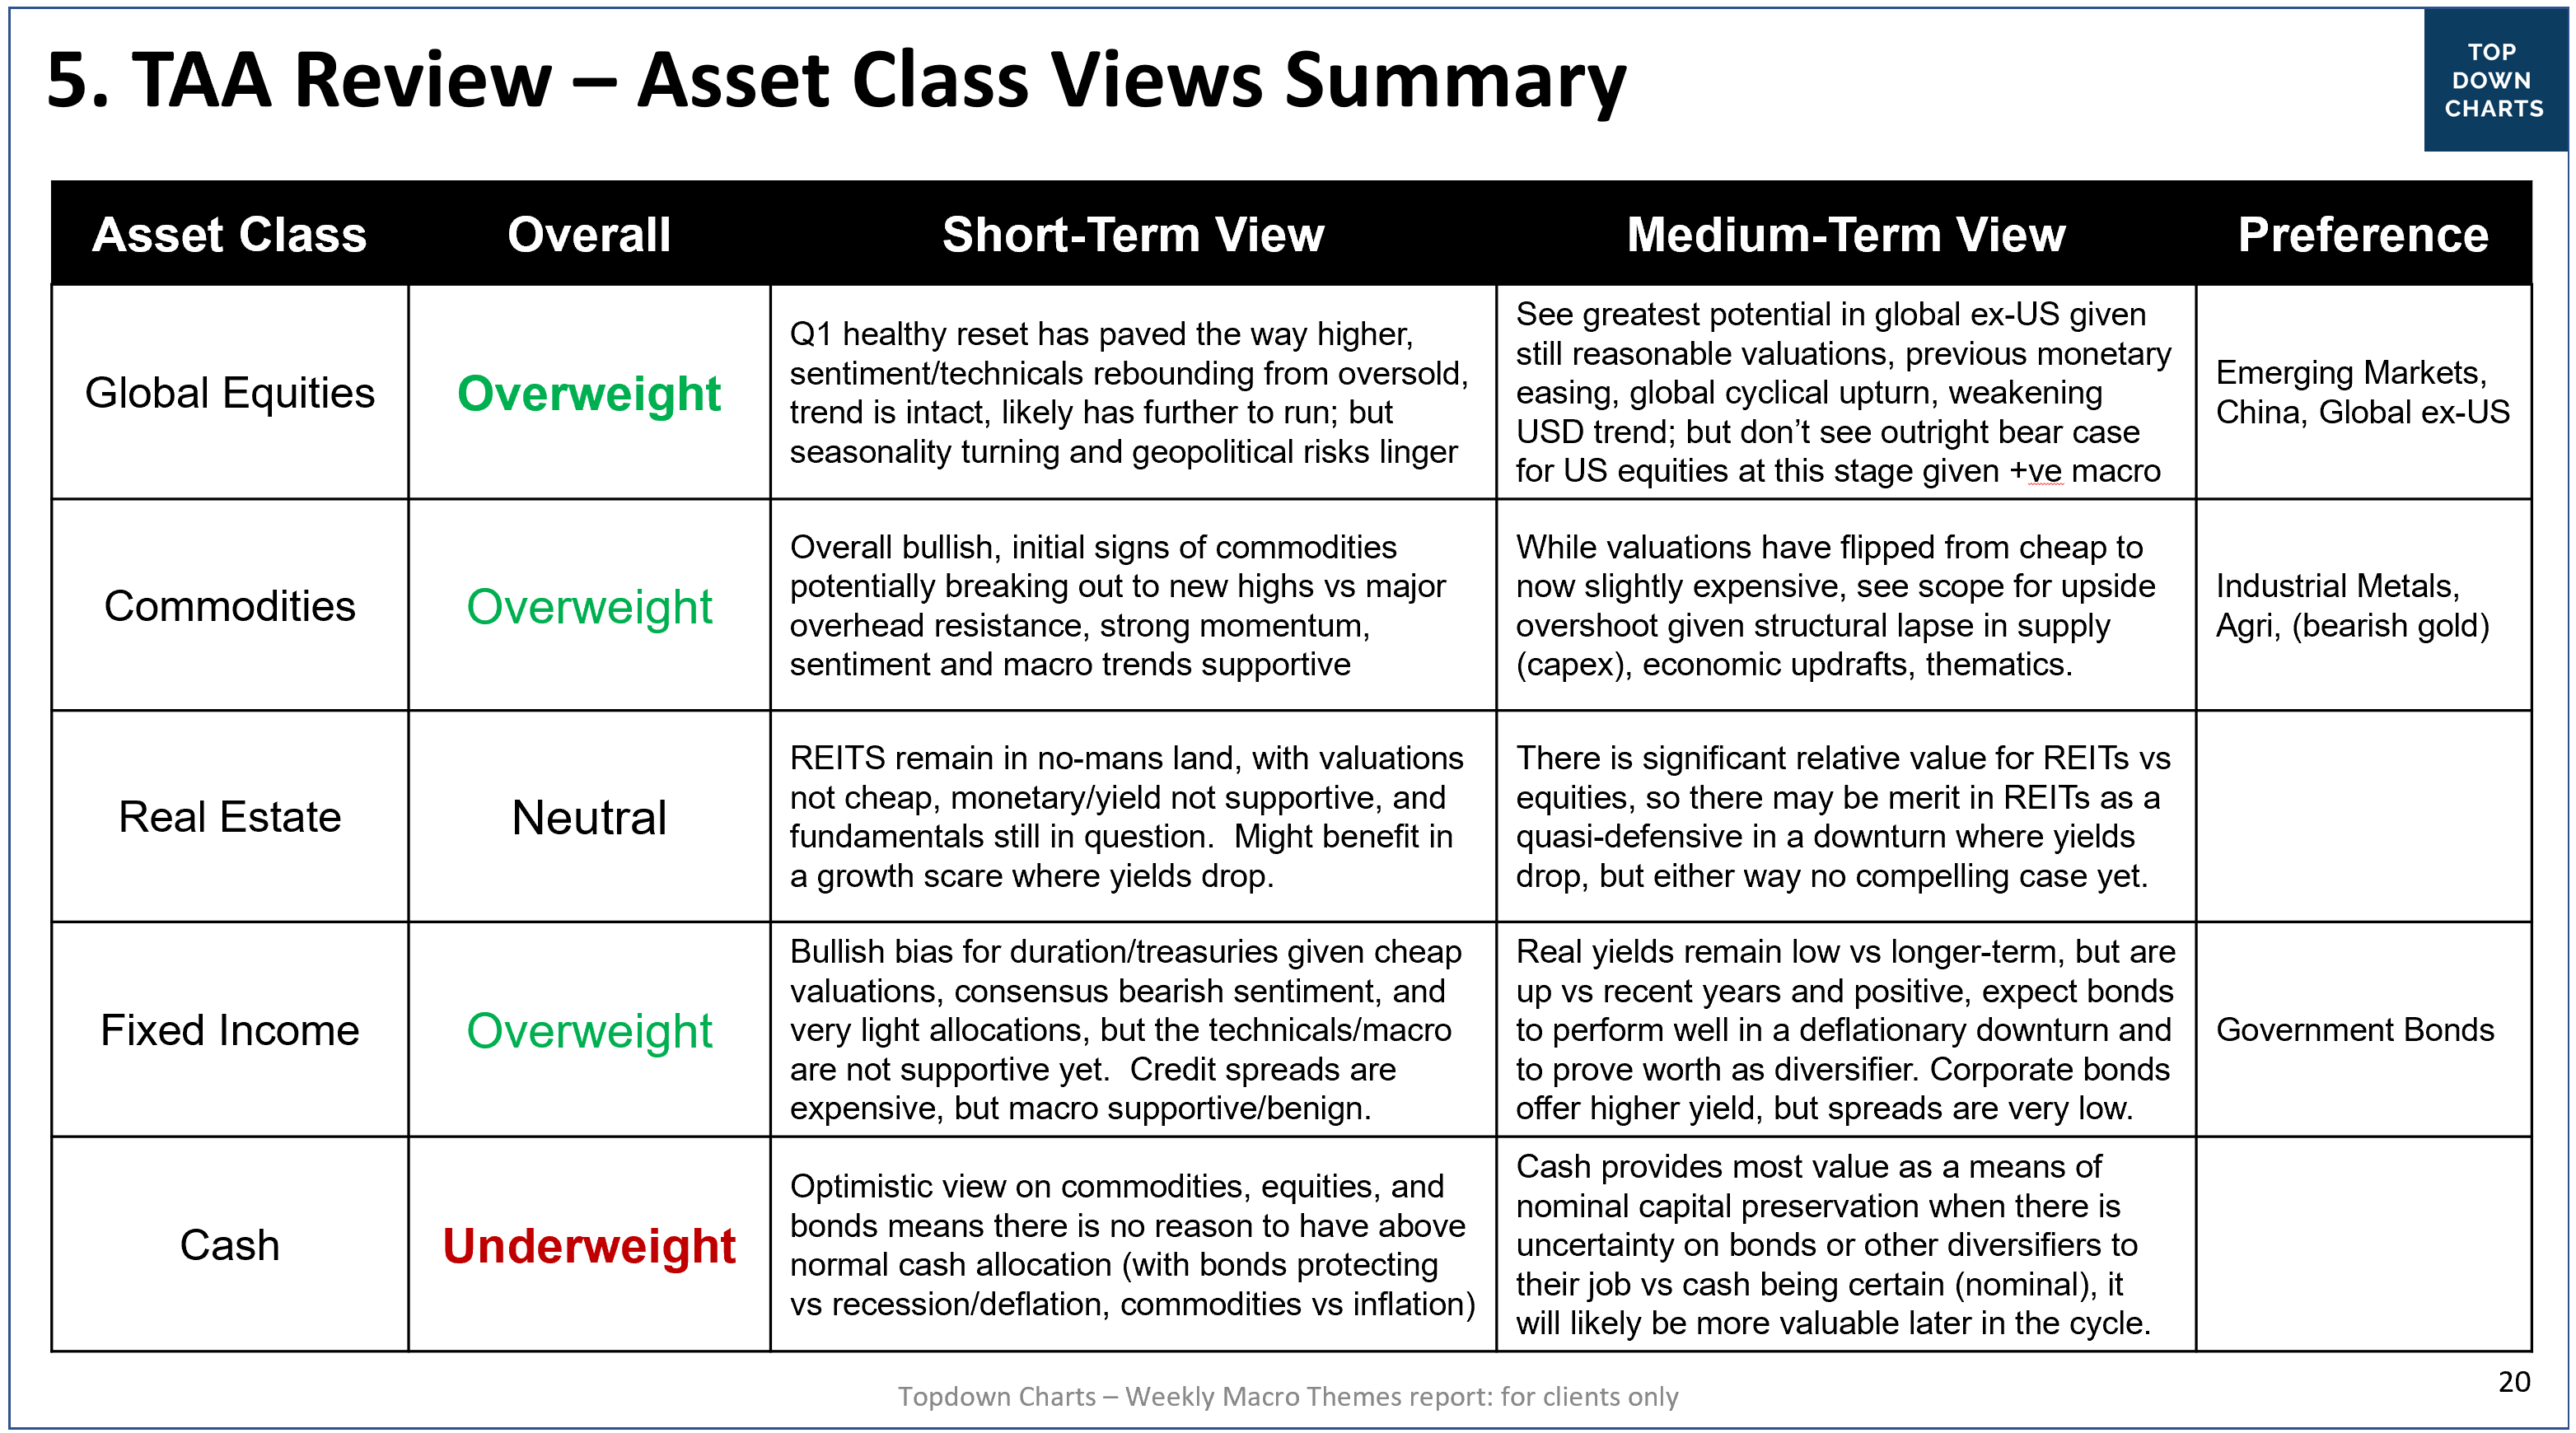
In addition to the above, clients are also provided with the below major asset class views cheat sheet, which provides a written assessment on the short-term outlook [weeks to months] and medium/longer-term outlook [months to years].
Performance of Topdown Charts TAA Model: since commencing the monthly TAA review back in mid-2017 the Topdown Charts TAA model has performed well in absolute terms and relative to simple quant models (see the chart below).
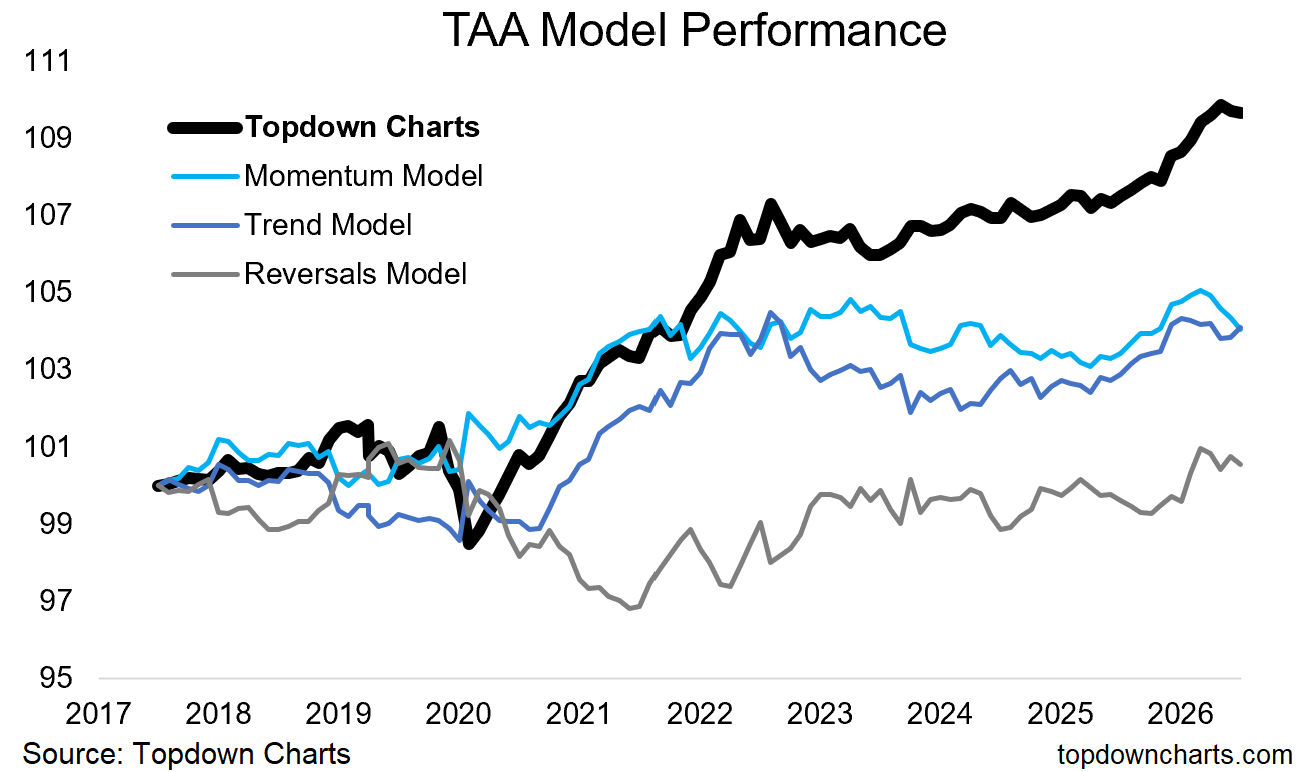
NOTE: the above is calculated on relatively small over/underweights (minimum tilt of 2% and maximum tilt of 10%), and does not take account of any fees/alpha/tax or any other implementation considerations. Also, for clarity, clients would typically implement TAA against an existing portfolio; tilting around their strategic asset allocation benchmarks. In practice some might be using larger tilts, and hence generating larger alpha from tactical/dynamic asset allocation operations.
This information is also used by those who do not run fixed/set strategic allocations, to help shape their portfolios and overall asset mix over time —alongside the specific ideas in the Weekly Reports. In that sense it is both an additional resource and compliment to the ideas and insights from the regular reports.
Do you hold webinars or Q&A sessions?
Yes, every quarter we go through the “Quarterly Strategy Pack“ —covering the big picture macro view, risk radar, how that ties into the key asset allocation decisions, and specific ideas/themes relevant to investors. During these sessions clients also get a chance to ask questions and participate in live Q&A.
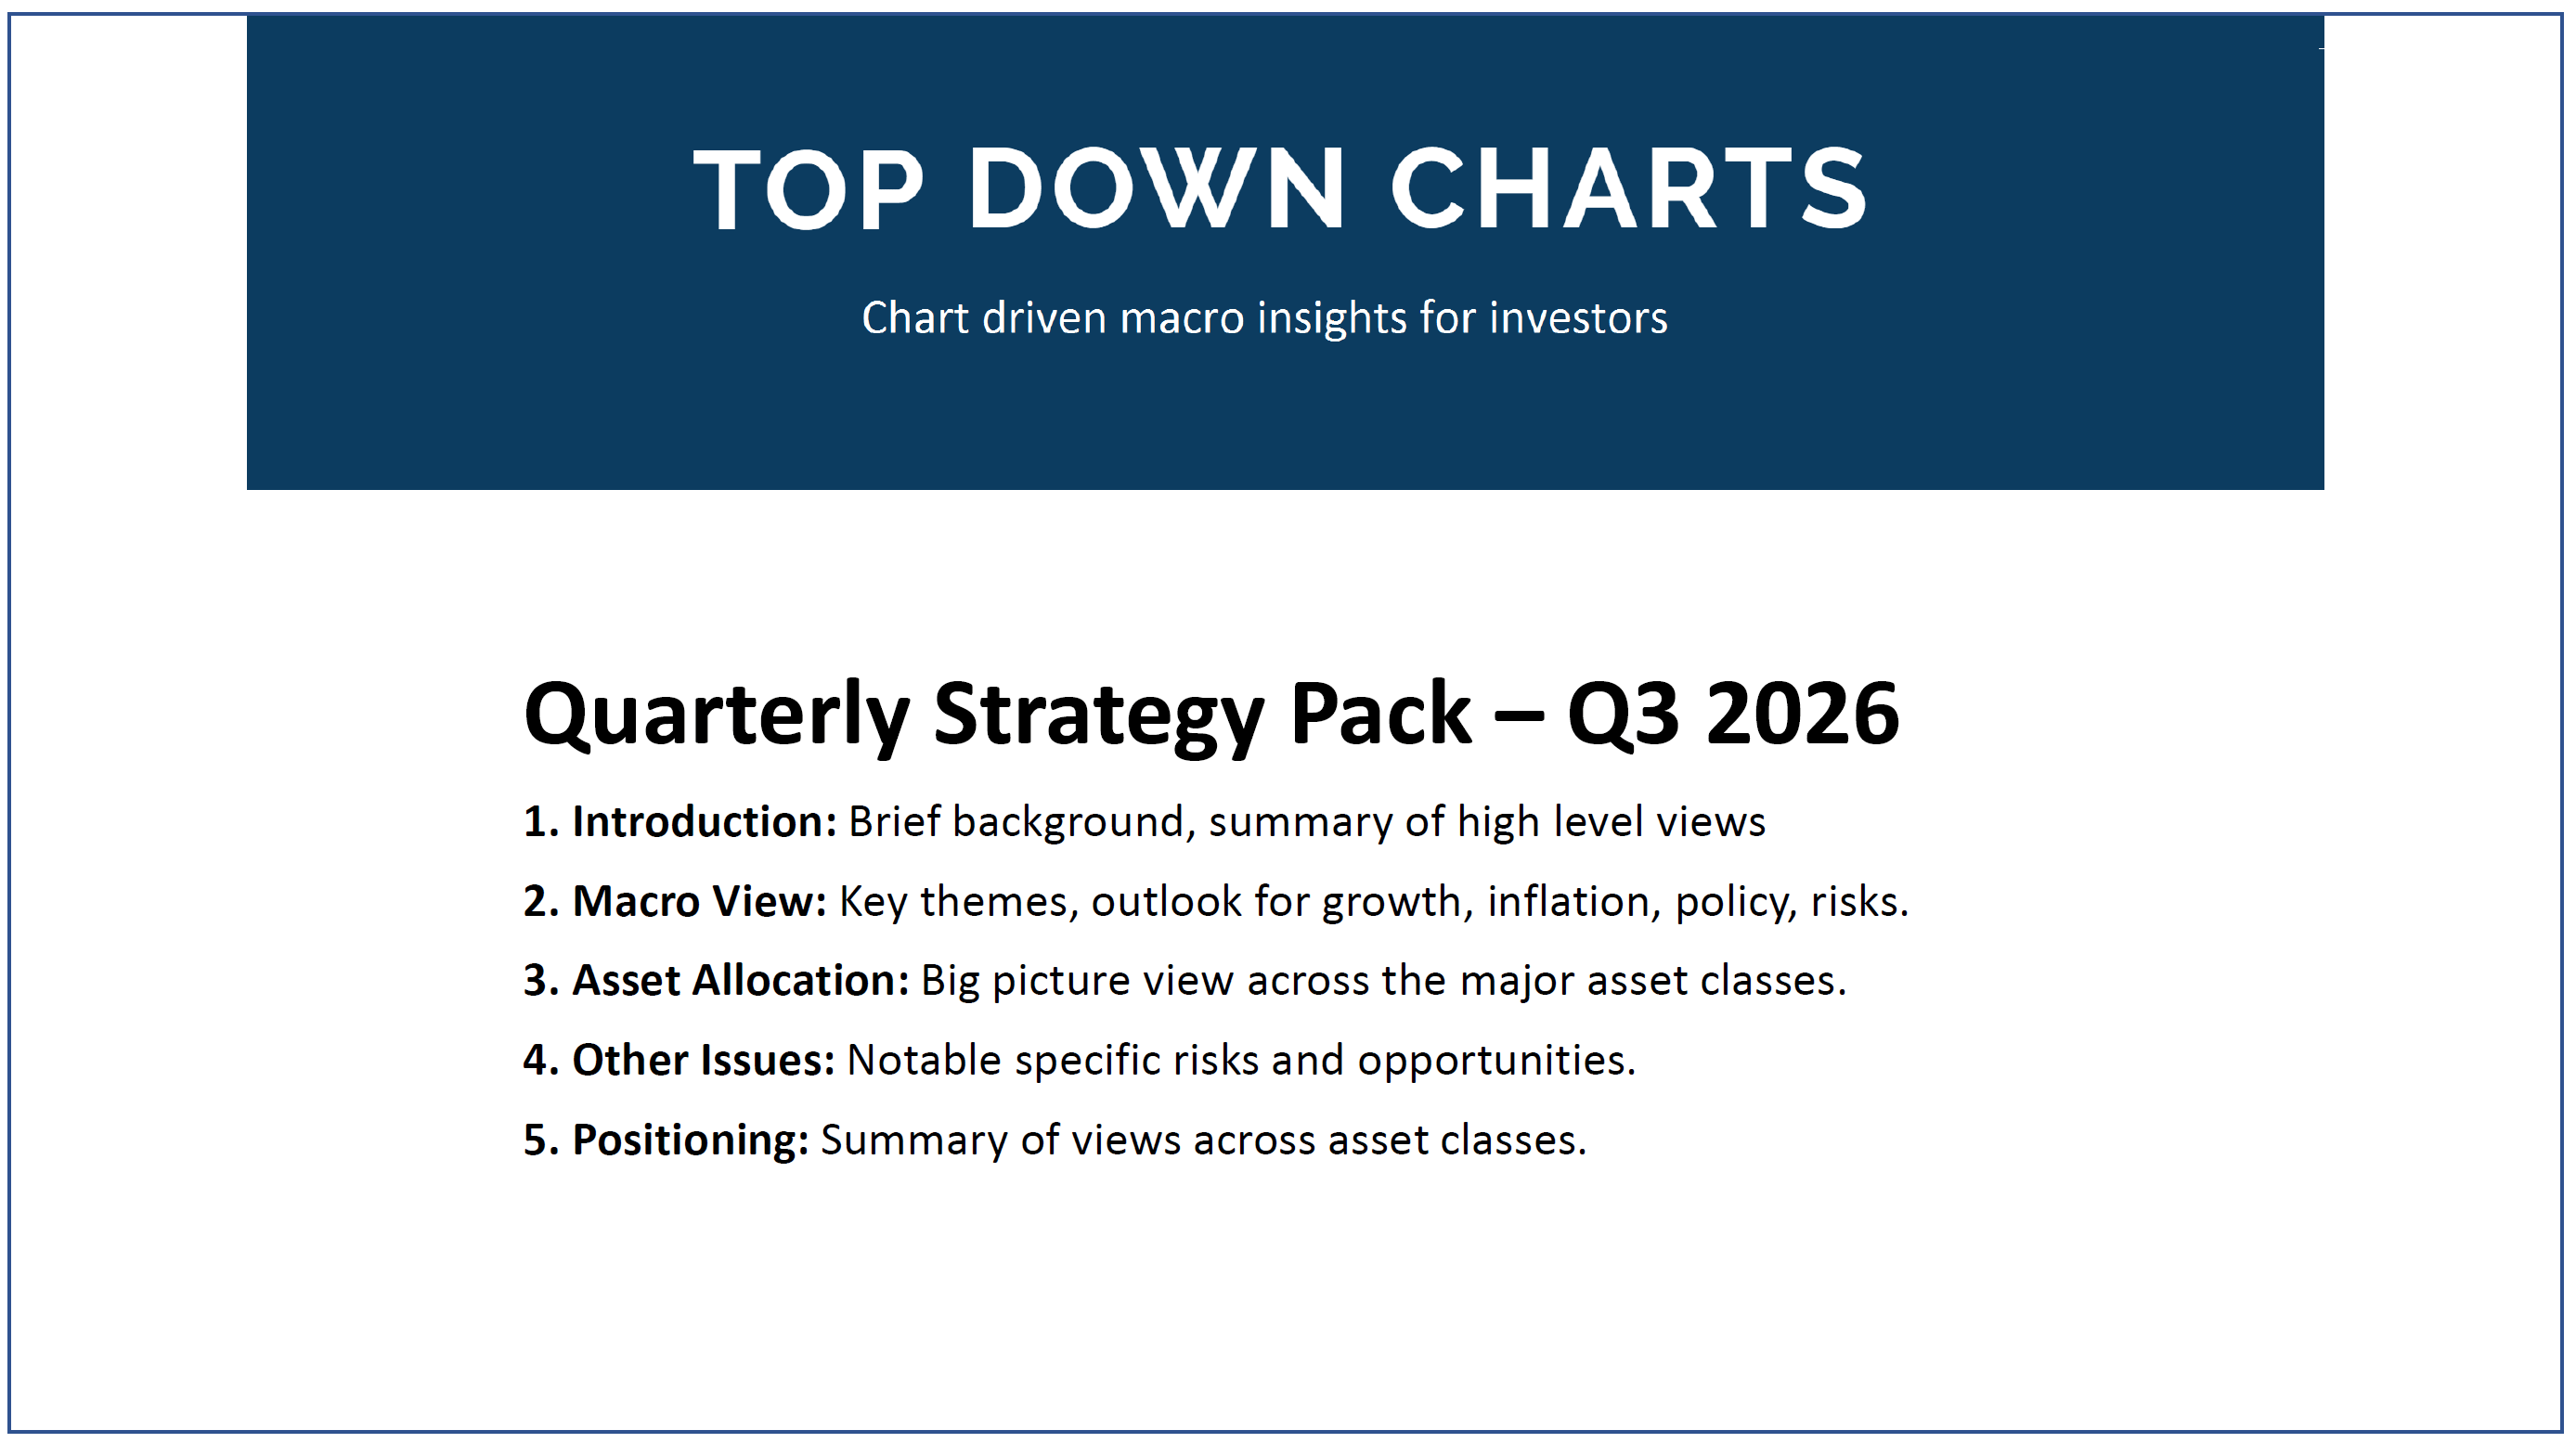
In addition to that, subscribers are welcome to join the discussion in the comment section on the website, or email the Head of Research directly if they have any questions or requests.
So you will never feel like you’ve been left on your own to figure it out,
and in fact over the years client discussions have contributed to expanding coverage, depth, and relevancy of insights —and in our view represent a chance to add extra value to clients, so you are definitely encouraged to get in touch.
Who is the Founder of Topdown Charts?
Callum Thomas is Founder and Head of Research at Topdown Charts. A former multi-asset investment strategist at AMP Capital/AXA Global Investors, he launched the firm in 2016 to deliver chart-driven, conflict-free macro research to professional investors.

Over a decade of weekly reports, he has built a solid track record, deep analytical resources, and a client base that includes hedge funds, family offices, and some of the world’s largest fund managers.
Callum is known for identifying major macro-market shifts using a blend of valuations, monetary conditions, cyclical indicators, sentiment, positioning, and technicals. His signature charts and calm guidance has helped clients successfully navigate through some extremely challenging market cycles.
Over 300,000 people follow him on social media, and his work is cited by high-profile financial commentators such as John Authers and Albert Edwards.
Callum’s buy-side background means the work is built around the “so-what?” for portfolio managers: ideas, risk flags, and usable charts —not just commentary for commentary’s sake. You will never be left guessing.
Callum holds a Bachelor of Business Studies (Finance), plus postgraduate qualifications including a Master’s in Management (Banking) and a Master’s of Finance, all from Massey University. His strong academic background has been tempered through over a decade working on the buyside as a practitioner and now more than a decade as a research publisher.
All of this means he is able to offer a responsive, practitioner-oriented service model —research plus the ability to answer “what should I actually do with this?”
His mantra: clear, concise, and insightful.
Vision for Topdown Charts: Become an indispensable and sought-after resource for global multi-asset investors.
Mission: Deliver a consistently excellent and always improving world leading investment research service that brings clarity and perspective and adds value.
[see a full explanation of the Topdown Charts Vision/Mission here]
Callum also writes the highly rated Weekly ChartStorm newsletter (which he has done so, every weekend, without fail, since 2015).
What is his Track Record?
Head of Research & Founder of Topdown Charts, Callum Thomas, has an excellent track record in his macro and market calls. He credits this to his data-driven, evidence-based, and chart-focused approach — it is a matter of finding puzzle pieces to solve the picture; and Topdown Charts has excellent depth of resources and skill in putting those puzzles together for clients. You can find specific details on his track record [here], and you can see what clients say about his service [here].
Here are some of his most notable macro/market calls over the years:
Documented and identified the 2016/17 new global equities bull market, China stimulus/macro up-turn and breakout in copper prices (along with global trade revival and general global cyclical upturn).
Predicted the major global equity correction in 2018 (clearly identified the policy pivot to tightening against a backdrop of extended valuations + overenthusiastic sentiment and technical risk signals).
Also flagged the subsequent rebound in 2019 (as sentiment got washed out, valuations became cheap again, and central banks pivoted back to easing).
Turned bullish on risk assets in March 2020 (big washout in breadth, valuations falling to extreme cheap, policy pivot to stimulus, and calm clear-headedness on the realistic macro path as the pandemic unfolded).
Predicted the big global policy pivot to stimulus in 2020.
Also predicted the subsequent pivot back to tightening in 2022.
(and again back to easing in 2024).
These policy pivots had a huge bearing on the outlook for macro and markets, and remain front of mind once again right now.
Identified the big slump in global commodity producer capex (“commodity capex depression)“ before anyone else (which paved the way for the commodity bull market in 2020-22, and again in 2025-26).
Correctly anticipated the commodity bull market 2020-22 (valuations dropped to cheap levels, capex slumped [supply tailwinds], stimulus/demand-shock, and sentiment/technicals aligned; also, the correctly identified geopolitical event risks in 2022 gave this call a further boost).
Foresaw the big upswing in inflation post-pandemic (partly as a consequence of rising commodities, along with supply + demand shocks, and central banks staying well behind the curve on hikes).
Steered clients away from stocks/bonds in 2022 and into cash/commodities (in particular identified that both stocks AND bonds were extreme expensive late-2021, while commodities were still cheap; the clues were there for those with the willingness and ability to search for them).
Correctly identified bull markets in Japan and EM equities 2023-26 (gains of +137% and +94% respectively, valuations, improving macro, policy, supportive technicals, sentiment, positioning made the case clear; until 2026 when the case no longer looked bullish and risks began to shift).
Flagged and closely tracked the strong absolute and relative performance of Global (ex-US) Equities [notably specifically in China and LatAm] during 2025 (particularly vs US as Trump 2.0 played a very different script to 2017; which was also a key risk identified in advance).
Why should I give this service a try?
Because Topdown Charts Professional is built for portfolio managers, advisers, and serious multi-asset investors who need a cleaner, clearer top-down view — without wading through noise.
You get chart-driven research designed to help you:
Spot ideas with a published track record (70%+ hit rate on specific investment ideas);
Flag risks before they become portfolio problems;
Stay current on the macro-market cycles that drive asset allocation so you can build and protect wealth.
The core service includes the Weekly Macro Themes report and the Quarterly Strategy Pack (plus webinars/Q&A). You can also use the charts in client and stakeholder materials, and you get help with questions and requests.
It is independent, visual, and built by a former buyside multi-asset strategist — so the research is practical, not academic. Sign up in minutes, cancel anytime, and start making decisions with more context and less guesswork.
What do I get as a Paid Subscriber?
The service is reports based, and there are two key reports.
The Weekly Macro Themes Report: each Friday clients are sent an easy to digest chart pack with a combination of investment ideas, risk alerts, and macro trends. Clients should expect to get actionable ideas from this pack along with critical macro-market context to help navigate the market cycle, manage downside risks, and bring fresh ideas into their portfolios.
The Quarterly Strategy Pack: at the start of each quarter this slide deck takes you through a power-packed look at the big picture macro outlook, risk radar, asset allocation implications, and specific ideas. Clients are also invited to join webinars/calls to go through the pack for extra context and explanation + Q&A discussion sessions.
Aside from the reports, clients are also encouraged to ask questions in the comments section or by email. Direct access to the Head of Research is a key part of the service, and many clients find this really valuable.
I also welcome topic suggestions/requests which many clients find helpful (albeit, I endeavor to cover issues that you are likely to be thinking about already, or will soon need to think about! —so I basically try to anticipate the questions that might be asked and research those topics/issues in advance).
Who is this service for (vs who is it not for)?
This service is designed for serious investors who require evidence-based top-down inputs to help them make better investment decisions with confidence.
Specifically, please see the following use cases:
Active Asset Allocators: use the monthly TAA review and ideas from the weekly reports to help make active asset allocation decisions (e.g. raising or reducing exposure to certain asset classes), and use content from the reports in their investment committees and client reporting.
Wealth Advisors: use ideas and risk alerts from the reports to help grow and protect their clients wealth + stay informed on the big picture macro perspectives to help answer client questions and deliver strong guidance to their end clients through the ups and downs of the cycle.
Fund Managers: use the macro insights and ideas on sectors, regions, rates, commodities, currencies to help refine and finesse their security selection and overall investment strategy.
Family Offices: use the reports to help inform investment decisions, stay alert to trends and developments that might negatively affect the family’s assets & affairs, and keep family members and stakeholders up to date on the key issues impacting their investments.
Professional Investors: serious investors and high net worth individuals use the reports to help manage their personal investment funds, stay informed, uncover opportunities to build wealth, and steer clear of risks to protect their nest egg. This includes those focused on building wealth (often still working), those who have retired (and may be more focused on protecting and making the most of their funds), and those in between.
All 5 of these groups also value the quarterly check-ins where the Quarterly Strategy Pack lays out the big picture issues and the webinar/Q&A sessions gives a formal forum for discussion and questions. They also value being able to access me directly by email or in the comments with any observations, requests, or questions they might have about the content or in general.
This service is NOT typically suitable for the following:
Short-Term Traders: the ideas covered in the reports are typically spanning months, and sometimes years. This is not suitable for day traders. That said, some shorter-term traders do value the big picture perspectives in our work, which helps in keeping check on the major macro-market currents/trends and where pressures might be building up.
Private Market Investors: we primarily cover public markets (stocks, bonds, currencies, commodities, things that are generally transparent, liquid, standardized, and often exchange-traded), so those primarily focused on illiquid/alternative/private market assets (such as venture capital, niche real estate, private equity) may not find the content directly useful —but again, a select few in this category might still benefit from the overall views on where public markets are tracking (e.g. valuations, capital market activity, interest rates, and other key macro variables that may impact their investments).
Quant/Systematic Traders: although the service is heavily data-driven and evidence based, ultimately the research outputs are discretionary (judgements based on the charts and data). Again though, some people who work at quant firms find the service useful to keep informed on macro/market issues, and some even use the reports for ideas/clues on what to look at to help optimize their signals and strategies + research direction.
The service may also be of only limited value to smaller investors and beginners —while the highly visual chart-based nature of the reports does make it accessible, it is aimed first and foremost at institutional investors and it does assume a basic level of knowledge (and assumes the budget for it to be economical; most of our clients use the service to earn multiple orders of magnitude of economic value vs the cost).
That said, it can also be an excellent way to help expand your knowledge base, and even our most sophisticated clients find they regularly learn something new from the reports and angles that they never considered before. So it can still be a highly worthwhile investment from that point of view.
What do paid subscribers say about the service?
Clients of Topdown Charts consistently say they like the chart-focused visual nature of the reports, and how it helps save them time through how concise the reports are (easy to read) but also how comprehensive the coverage is (don’t need to trawl through multiple sources as they can get it all here).
They also value the consistency in terms of the standardized approach and framework + reliability (regular updates on live ideas/views, as well as new ideas), so they know what to expect and can rely on it.
Last but not least, they value the accountability (transparency on performance, tracking), independence (objective and unbiased check on the world), and actionability of the reports (ideas you can actually use, timely coverage of risks that might impact portfolios, and macro perspectives that logically and directly flow to actual investment implications). So it is something that truly adds value.
For specific testimonials/references and reviews [Click Here]

How do I sign up?
Simply click the subscribe button and select between either an annual subscription of US$3500/year, or a monthly subscription paying US$350/month. Note: you can cancel at any time and there is no lock-in.
For corporate and institutional clients, you can easily self-onboard by choosing either a single-user subscription or a group subscription [n.b. please Contact Us for group pricing] — please also get in touch for manual invoicing, CSA/Softdollar, and/or due diligence and any other requests to help streamline the process and assist with budget/purchasing approvals. We have long experience with corporate and institutional clients and can definitely help make the onboarding process smooth and easy.
How can I unsubscribe or cancel my subscription?
Whether you’re a free or paid subscriber to Topdown Charts, you can unsubscribe or cancel your subscription at any time, and it’s quick and easy to do:
If you’re a free subscriber, click here for easy instructions on how to unsubscribe
If you’re a paid subscriber looking to cancel your subscription, click here
Can you help me with Troubleshooting?
I am always happy to help, but here’s some guidance and links for easy-to-follow instructions to help resolve the most common issues that get raised.
How to Log On — if you have trouble logging on see detailed instructions here [click].
Not Receiving Emails — the first thing to check is make sure the emails haven’t landed in your spam/junk box (maybe add the sending address i.e. topdownchartspro [@] substack.com to your contacts or whitelist), but failing that please see detailed instructions here to fix it [click].
Change your Email Address — please note I am unable to change your email on my end, you will need to do that yourself in Substack, detailed instructions here [click].
Update Credit Card Details — simply visit the account settings page for the email your signed up under at Substack, see detailed instructions here [click].
Cancel Subscription — you can easily unsubscribe at anytime but clicking the unsubscribe button, or you can log-in to Substack and update your settings, see detailed instructions here [click].
For anything else either get in touch (you can click the below button to direct message me, or you can reply to any email from me, or post in the comments section).
Please also review the Substack Support section for any other technical matters that may arise around your account, access, or admin/billing etc.
But otherwise I hope you have a smooth and trouble-free experience with us, which the overwhelming majority of people do.
I have further questions. How can I contact you?
You can contact us through Substack’s direct message feature (click button below) or by emailing callum.thomas [,at,] topdowncharts.com or via the website contact page. We’ll do our best to answer your questions and assist you.
Thanks for visiting, I look forward to hearing from you.
—
Best wishes,
Callum Thomas
Head of Research & Founder at Topdown Charts
Connect: LinkedIn | Twitter/X | Substack
Disclaimer: the information provided by Callum Thomas, Topdown Charts, and related content is for informational and educational purposes only and should not be construed as investment, financial, or trading advice. Nothing in this publication constitutes a recommendation, solicitation, or offer to buy or sell any securities, commodities, or financial instruments.
All investments carry risk, and past performance is not indicative of future results. Readers should conduct their own research and consult with a qualified financial advisor before making any investment decisions. The author and publisher disclaim any liability for financial losses or damages incurred as a result of reliance on the information provided.