
On this page you will find key information on the track record of Topdown Charts. You can click below to navigate sections.
Executive Summary
Topdown Charts was established in 2016 to deliver chart-driven multi-asset research and macro insights. Over the past decade the service has proven its worth with consistent strong performance of individual ideas (70% hit rate, average profit of 38% and average loss of -10%, and thus positive expectancy of +23%). The monthly TAA model has performed well in absolute and relative terms. And overall the service has provided clients with a consistent flow of useful insights, analysis, and ideas.
Client Testimonials also affirm these points, and the value of the service.
Performance of Specific Ideas/Views
The core Weekly Report (the main report for the Topdown Charts Professional service) has been published since 2016. The ideas inventory table pictured below was implemented in early-2020 (to track live and closed ideas/views where a specific recommendation or viewpoint has been put forward in the report).
The below table shows summary stats from 2020-2026. Performance has been very good with the overall hit rate tracking at 70% and average profit for correct calls of +38% strongly higher than the average loss for wrong calls of -10% (this works out to a mathematical positive expectancy of +23%).

The table below shows a complete listing of closed ideas/views across this period (updated to 31 August 2026).
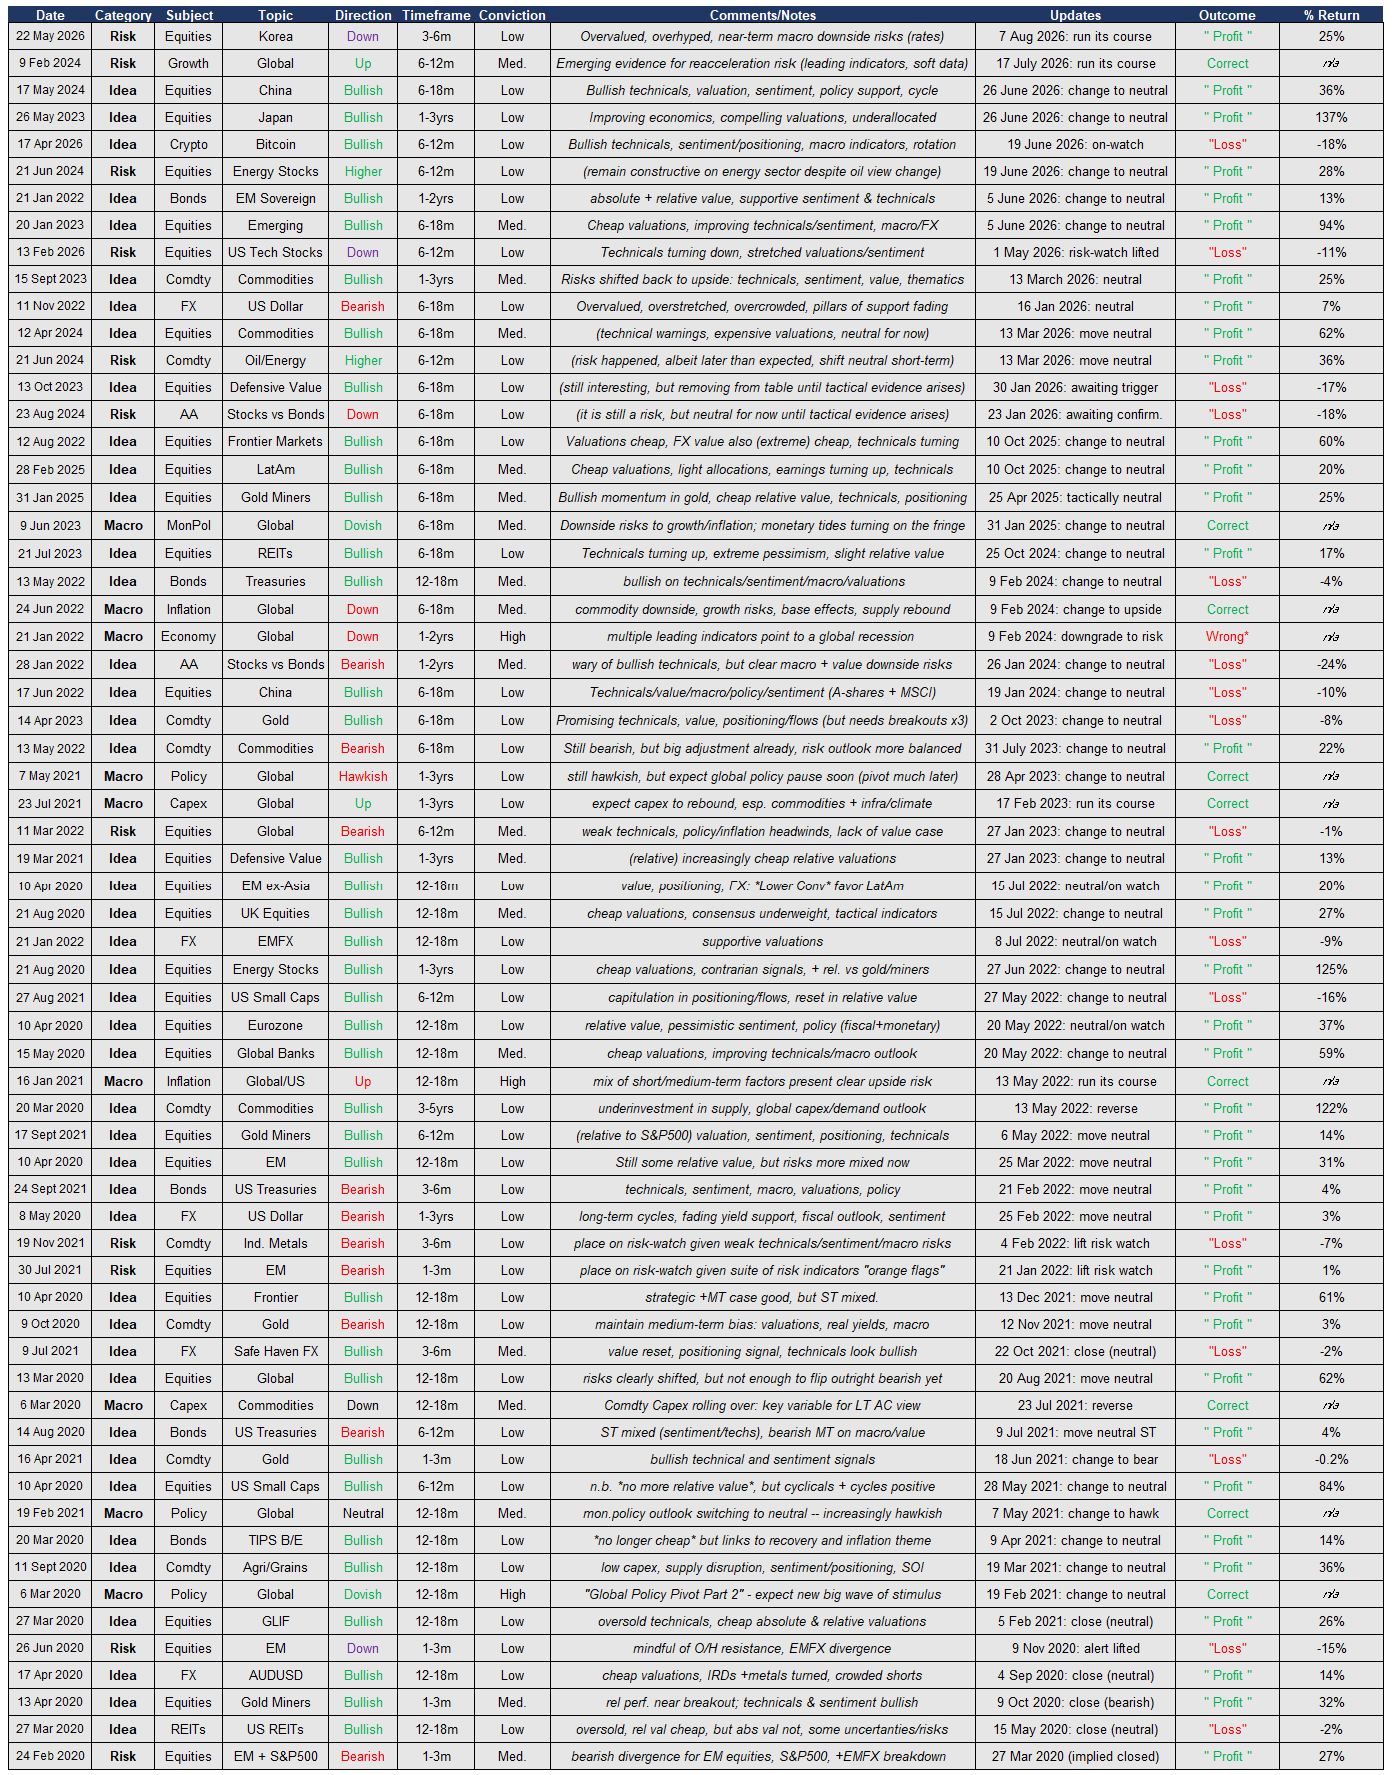
NOTE: the return column of these ideas/views is the percentage change of the best matching index to the original idea and does not include the impact of any fees, transaction costs, commissions, tax, etc — they do not represent an offer of financial products or securities and are not promise of expected results but are intended to show an approximate magnitude of performance of past ideas. n.b. past performance is not necessarily indicative of future performance.
As a brief explanation of the table, Date is the date of the report in which the idea was initiated and explained. The “category” denotes market view/idea as Idea, macro view as Macro, and Risk being a mix of both (often lower conviction).
The Subject denotes the main area of focus or asset class, and Topic refers to specific market/region/asset. Direction denotes the main view (e.g. up/down, bullish/bearish). Timeframe is the initial anticipated time for the idea or view to run its course. Conviction ranges High/Med/Low.
End of Year Special Reports
At the end of each year I go through all the report from the past year and pick out the best and worst charts/views + my personal favorites and honorable mentions. It is basically a report card on the year that was, and helps provide another angle on the performance of the reports and analysis — because sometimes it’s not so much my conclusion that makes the difference but the charts and macro-market visibility I bring clients.
Throughout the years the common theme has been: more good ideas than bad, and a consistent record of providing insightful and innovative charts, analysis, and actionable conclusions.
You can review the past decade of reports below:
2025 End of Year Special Report [click download below]

2024 End of Year Special Report [click download below]
Previous Years: 2023 | 2022 | 2021 | 2020 | 2019 | 2018 | 2017
p.s. stay tuned for this year’s End of Year special (due out mid-December)
TAA Model Performance
Each month clients receive Tactical Asset Allocation guidance — i.e. suggested over/under-weights across the major asset classes (along with asset class ratings across the Topdown Charts 5-Factor Framework, and written short-term + medium-term outlooks). This helps clients understand the relative risk/return outlook across the key asset classes and aids them in making adjustments to portfolios vs benchmark strategic asset allocations.
Since beginning the monthly TAA tables back in mid-2017 the Topdown Charts TAA model has performed well in absolute terms and relative to simple quant models (see the chart below).
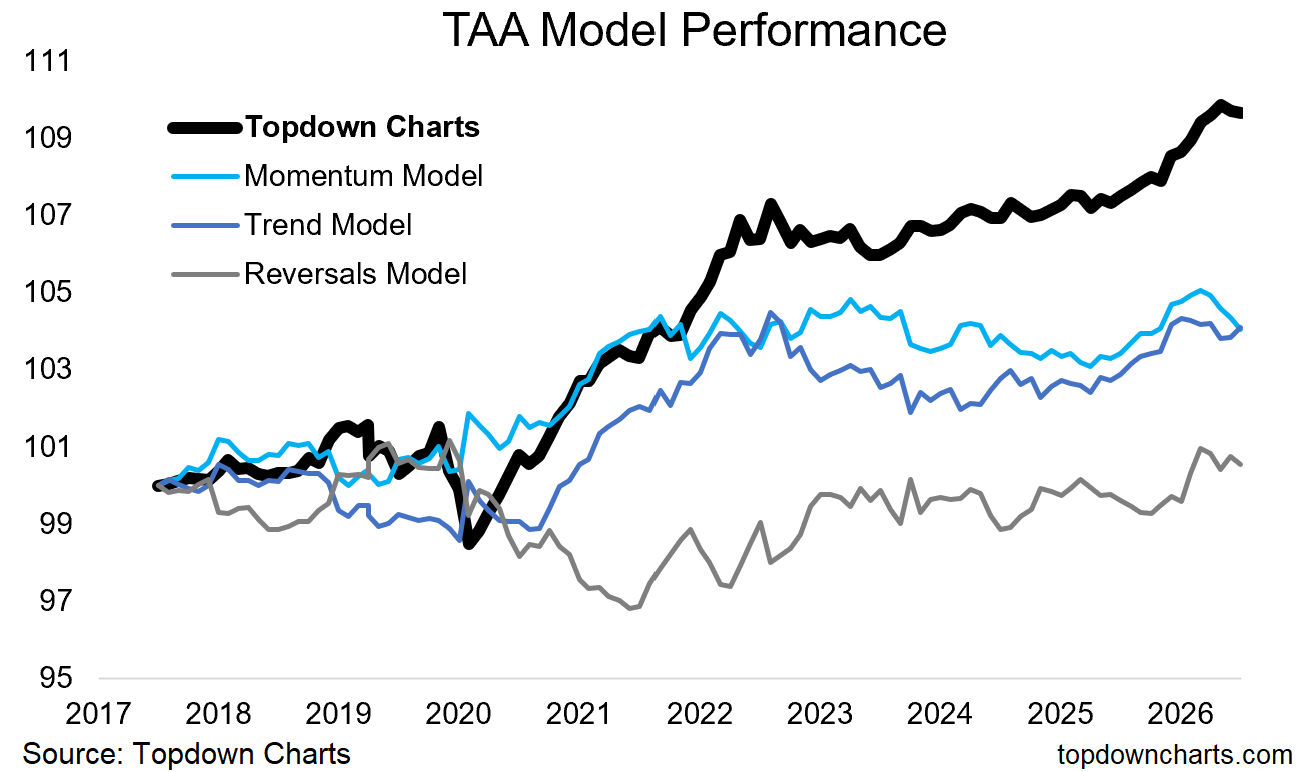
NOTE: the above is calculated on relatively small over/underweights (minimum tilt of 2% and maximum tilt of 10%), and does not take account of any fees/alpha/tax or any other implementation considerations. Also, for clarity, clients would typically implement TAA against an existing portfolio; tilting around their strategic asset allocation benchmarks. In practice some might be using larger tilts, and hence generating larger alpha from tactical/dynamic asset allocation operations.
This information is also used by those who do not run fixed/set strategic allocations, to help shape their portfolios and overall asset mix over time —alongside the specific ideas in the Weekly Reports.
Summary & Key Takeaways
Aside from standing the test of time (having now been in business over 10-years, and with an institutional client renewal rate close to 90%, the performance of the service has been excellent — as evidenced by the results here and client testimonials.
Here is a list of key points and takeaways:
Performance of specific investment ideas over the past decade has been excellent, with a hit rate of 70% and an average gain of 38% (vs average loss of -10%).
Macro calls over that period have had a 90% hit-rate, with much of these calls focused on the big picture global outlook (inflation, growth, policy).
Performance of the Tactical Asset Allocation model since inception in mid-2017 has been good in both absolute and relative terms.
This track record has been earned through some tumultuous times in macro and markets (multiple stockmarket corrections, stagflation episode, global pandemic, commodity booms and busts, wars, political shifts, policy pivots).
The track record of investment ideas spans across multiple different assets and markets — this along with the previous point means I am achieving my core goal for the service of generating profitable uncorrelated absolute returns across cycles and macro regime shifts.
The annual reports also highlight the hidden value of the service, which is the charts themselves; sometimes the puzzle pieces and macro context is even more valuable than a trade idea or recommendation.
Along with that, client feedback also affirms the value of staying informed, and clients consistently note that Topdown Charts helps them get visibility on the global macro-market backdrop, and helps with their reporting, committees, and communication deliverables.
Other Resources
I also recommend you check out the Client Testimonials section, because there is elements of the service and performance that are hard to capture objectively and quantitatively — so hearing from what actual clients say about the service can be highly helpful in evaluating whether to take up a subscription:

If you have any further questions, or require any additional details as part of your due diligence process, simply get in touch [click here].
—
Best wishes,
Callum Thomas
Head of Research & Founder at Topdown Charts
Connect: LinkedIn | Twitter/X | Substack
Disclaimer: the information provided by Callum Thomas, Topdown Charts, and related content is for informational and educational purposes only and should not be construed as investment, financial, or trading advice. Nothing in this publication constitutes a recommendation, solicitation, or offer to buy or sell any securities, commodities, or financial instruments.
All investments carry risk, and past performance is not indicative of future results. Readers should conduct their own research and consult with a qualified financial advisor before making any investment decisions. The author and publisher disclaim any liability for financial losses or damages incurred as a result of reliance on the information provided.