
Market Cycle Guidebook - May 2025
Asset class views, macro outlook, long-term expectations, and over 70 charts tracking macro policy, cycle data, and valuations across a global multi-asset universe...

We’ve just published the latest "Market Cycle Guidebook" — it’s one of the main reports in our institutional research service (see details + key findings below).
The monthly Market Cycle Guidebook is a key resource for investors — providing insight into the stage of the business cycle, monetary policy trends, leading indicators, earnings momentum, valuations across multiple different assets and markets, long-term return expectations, and tactical asset allocation views.
Key Findings from the Latest Monthly pack:
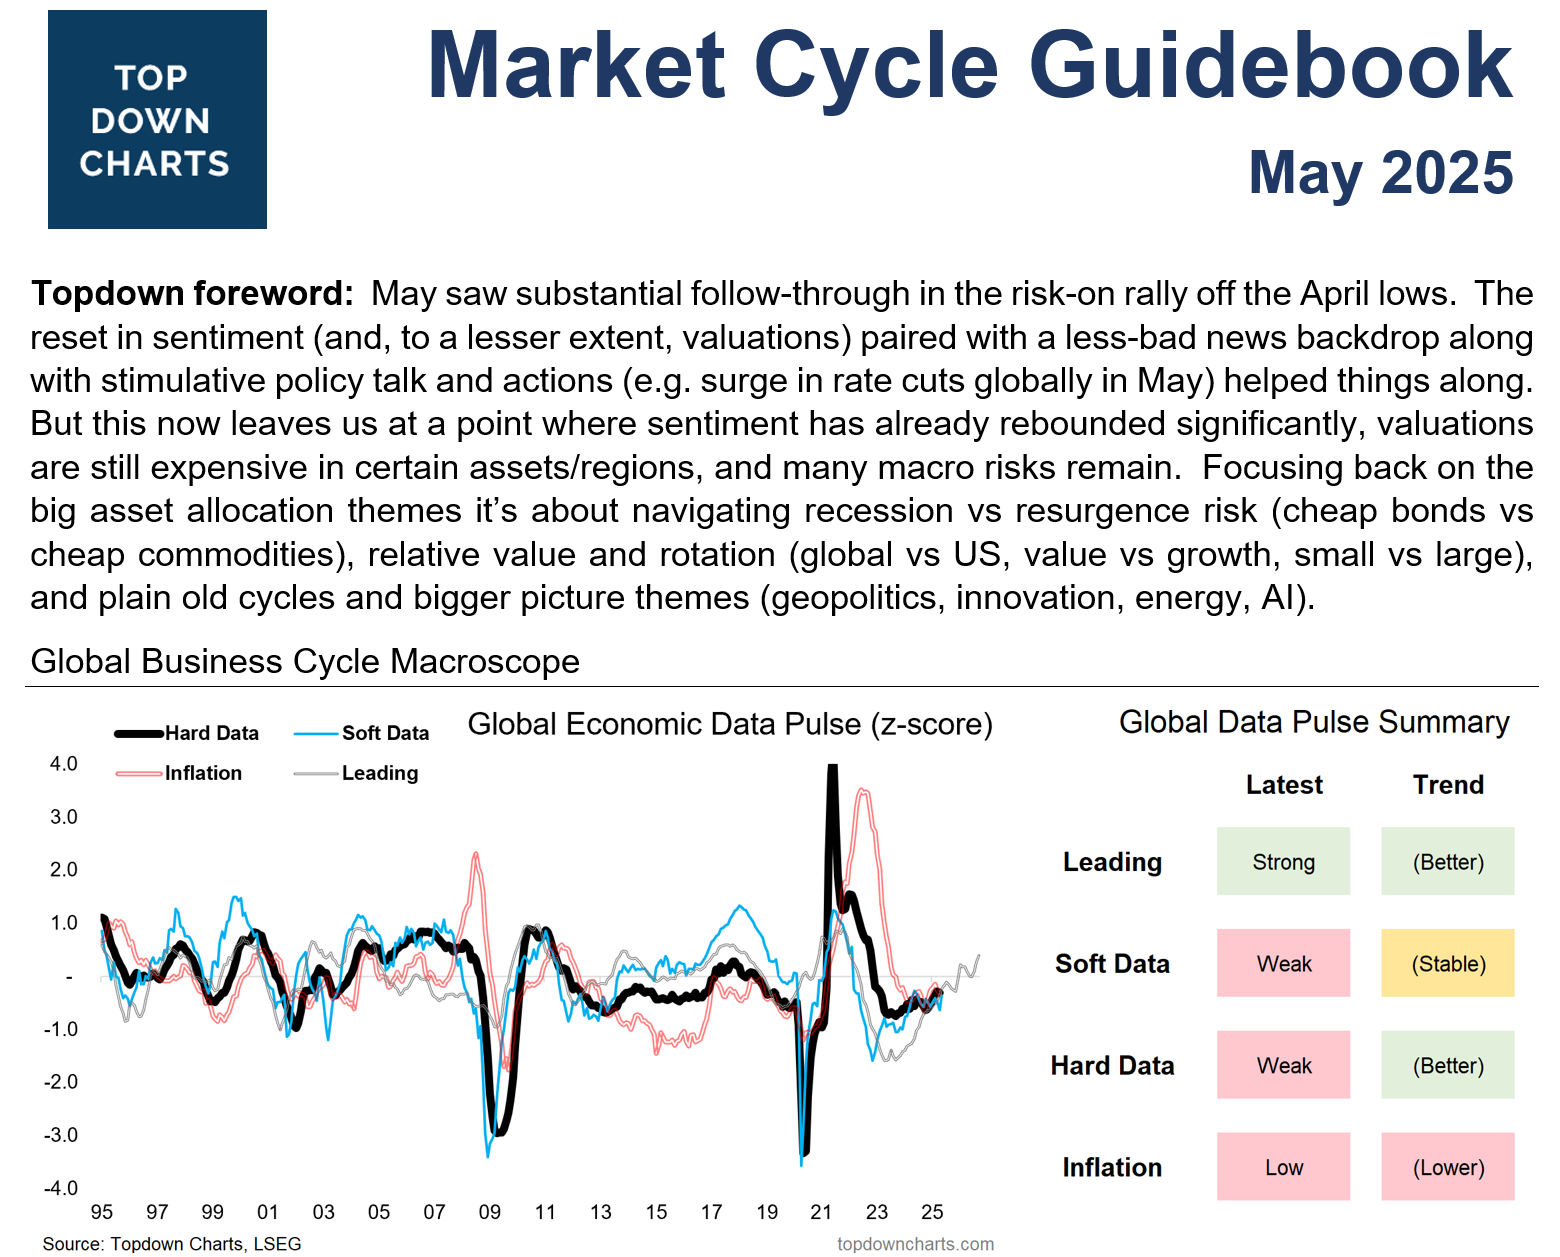
Global monetary policy settings are shifting from headwind to increasing tailwind as inflation falls and economic cycle data remain soft.
The big edge risks are recession + deflation on one edge vs reacceleration + inflation resurgence on the other edge.
The US faces heightened risk of recession given policy uncertainty and confidence shocks from the chaotic start to the year.
Meanwhile the rest of the world may well hold OK (Japan going strong, Europe and China turning up out of slowdown + stimulus).
This makes for a somewhat bifurcated outlook
Among the asset classes most at risk given valuations and the stage of the cycle are US tech stocks, US housing, US dollar, and US credit (spreads).
Areas which see superior upside risk/reward meanwhile include government bonds, commodities, emerging markets, and certain sectors on a tactical basis such as defensives, small caps, and frontier markets.
Rotation and Relative value are thus key themes along with smart diversification and risk management (diversify diversifiers, tactically upweight more attractively priced diversifiers).
(check out the full report to see the charts, views, and recommendations)
The best way to try out the Topdown Charts Professional service and get instant access to the latest reports + archive is to take a monthly subscription at US$350/month — n.b. you can cancel at any time or switch to annual payments instead whenever you choose. Alternatively if paying on an annual basis it’s US$3500/year per user (which works out cheaper overall).
Alternatively get in touch for a trial.
More information About the Monthly Pack
The monthly Market Cycle Guidebook is designed to be a practical & tactical asset allocation guidebook for global multi-asset investors +those who require visibility and insight on the big picture macro-risk outlook.
The images below provide a sense of what’s covered:

The pack focuses on illuminating the key drivers of risk and return across a global multi-asset universe, with the objective of generating actionable conclusions and meaningful insights for medium-term active asset allocation decisions.
The pack is of particular use to those with a longer-term timeframe and who need fact-based chart-driven evidence to support decision making, or those who take shorter-term positions but still want a pulse-check on the macro trends and themes that will ultimately filter through to short-term market outcomes.
Pick of the Pack — PE10 Valuations
This month’s most interesting chart from the pack is a look at Global Equity valuations. I think this one is particularly interesting as it shows how after a very brief and relatively shallow reset, US valuations are back toward the highs. Meanwhile the comparatively cheaper Developed Markets and Emerging Markets are turning up from historically low levels. It is clear to see where the relative value opportunity is here.
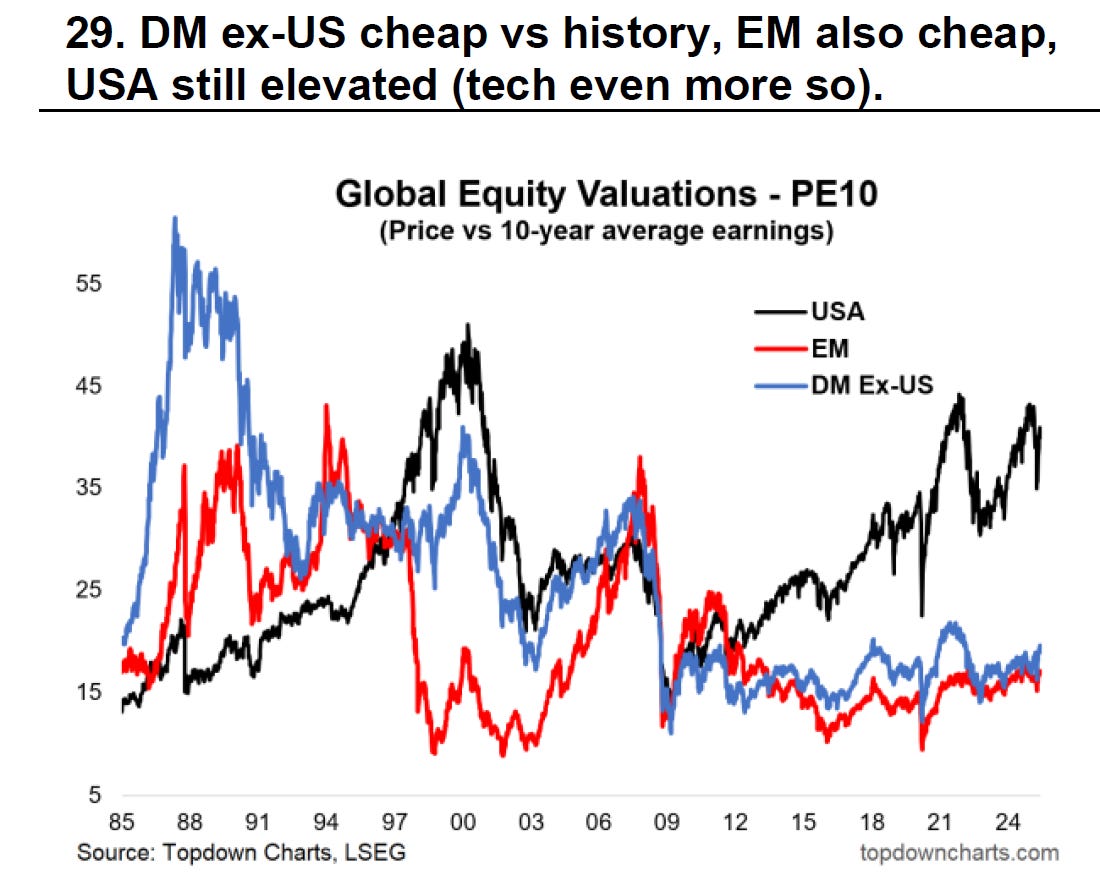
But with all valuation setups, be it absolute or relative, you still need the larger picture to come together in order to avoid falling into value traps. I believe this is underway; the peak in the US dollar, the extreme in relative value, turning technicals, and peak in relative earnings, along with a questioning of the US asset premium (given political risk) all point to a passing of the torch or at least catch-up by global ex-US.
Learn more about this theme and associated ideas — check out our recent reports.
Key features of the Market Cycle Guidebook:
-Instant overview of: global economic cycle, monetary policy, and valuations
-Market performance snapshot & commentary/highlights
-Summary views across asset classes (short and medium term); "cheat sheet"
-TAA/DAA guide visually mapping those views to recommended positioning
-Monthly updated Capital Market Assumptions
-And of course, over 70 charts illuminating the key medium-term drivers of risk and return across a global multi-asset universe
-Australia/New Zealand appendix (since we're down this part of the world!)
Click through to Learn More about this report and our services, or go ahead and subscribe now to benefit from ongoing access to this service (which is used by some of the largest and most reputable fund managers around the world):
Corporate & Institutional Clients
Get in touch if you need other payment options (for example, CSA payments and manual invoicing is also available if required), or pricing for teams/multiple users — if relevant you may request a trial, introductory call, or due diligence documentation to help with approvals and onboarding.
Otherwise, you can easily and simply self-onboard right away with the standard payment and subscription options [base rate is US$3500/user/year or US$350 if subscribing on a month-to-month basis] — simply select either a single user or group subscription as relevant below:
If you have any other questions or requests, just get in contact (n.b. you can reply to this email or reach me at callum.thomas@topdowncharts.com).
Best regards,
Callum Thomas
Head of Research and Founder, Topdown Charts
LinkedIn: https://www.linkedin.com/in/callum-thomas-4990063/
Twitter: https://twitter.com/Callum_Thomas
NEW: Services by Topdown Charts
Weekly S&P 500 ChartStorm — [US Equities in focus]
Monthly Gold Market Pack — [Gold market charts]
Topdown Charts Entry-Level — [entry-level service]
Australian Market Valuation Book —[Aussie markets]