

Hello and welcome to a new week - hope you have a good one!
The latest Global Cross Asset Market Monitor [Market Chart Pack] is attached below:
Topdown Charts Global Cross Asset Market Monitor 10032025
Global Markets Monitor -- Notable Developments
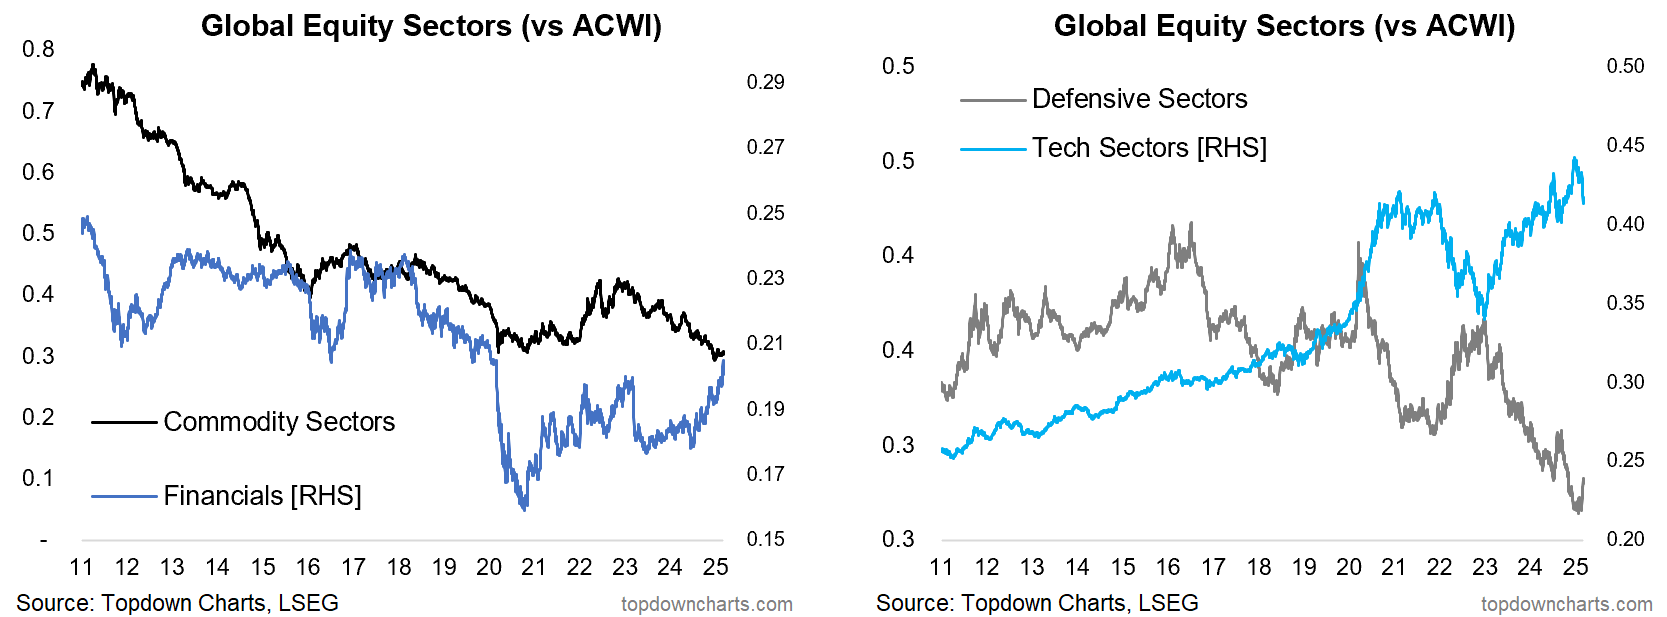
Most markets moved lower last week, but US fell the most; global is outperforming US in an apparent rotation trade as global appetite for US stocks souring given increasing policy uncertainty and recession risk. Also seeing rotation across sectors with tech losing ground and defensives gaining.
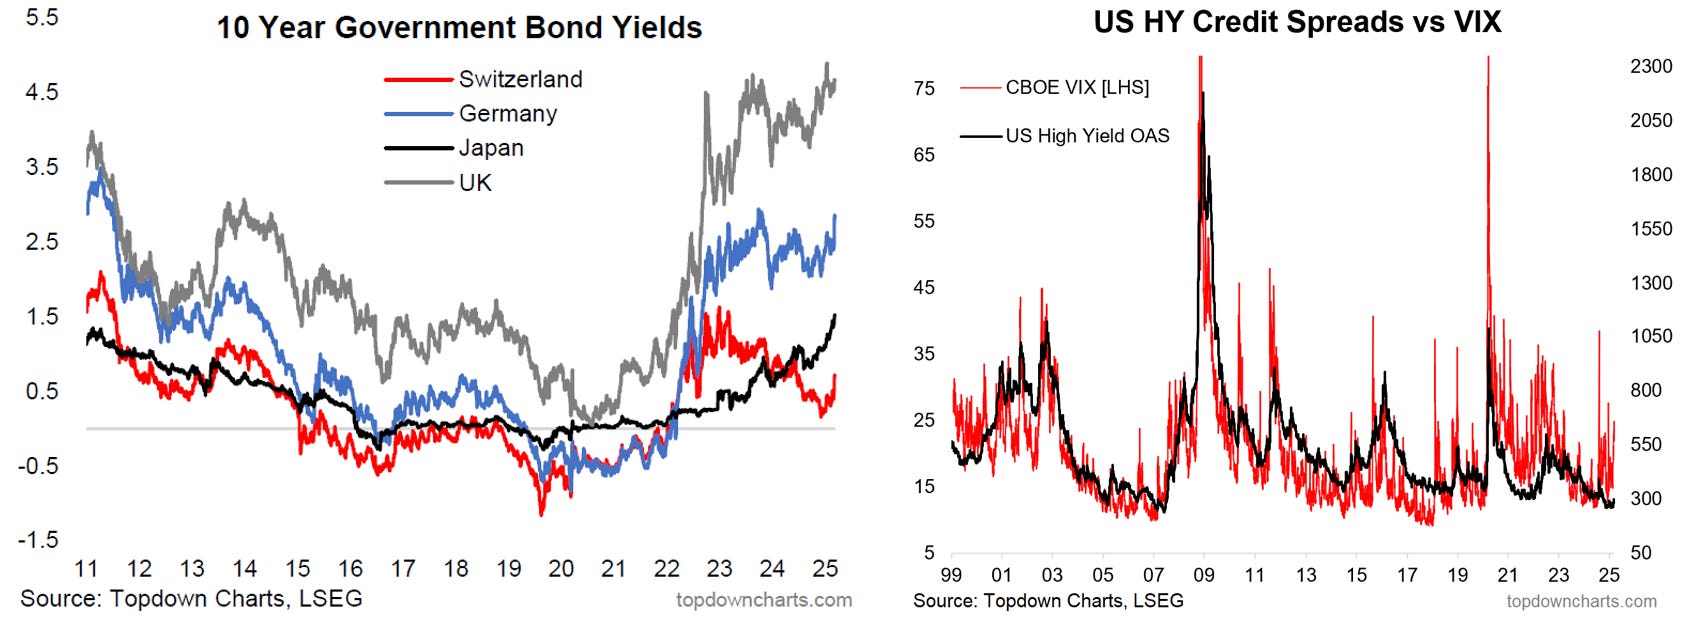
In fixed income, US treasury yields moved lower, but developed sovereign yields moved higher; Japan notably extending its move. Credit spreads ticked up slightly along with a wider uptick in risk pricing.
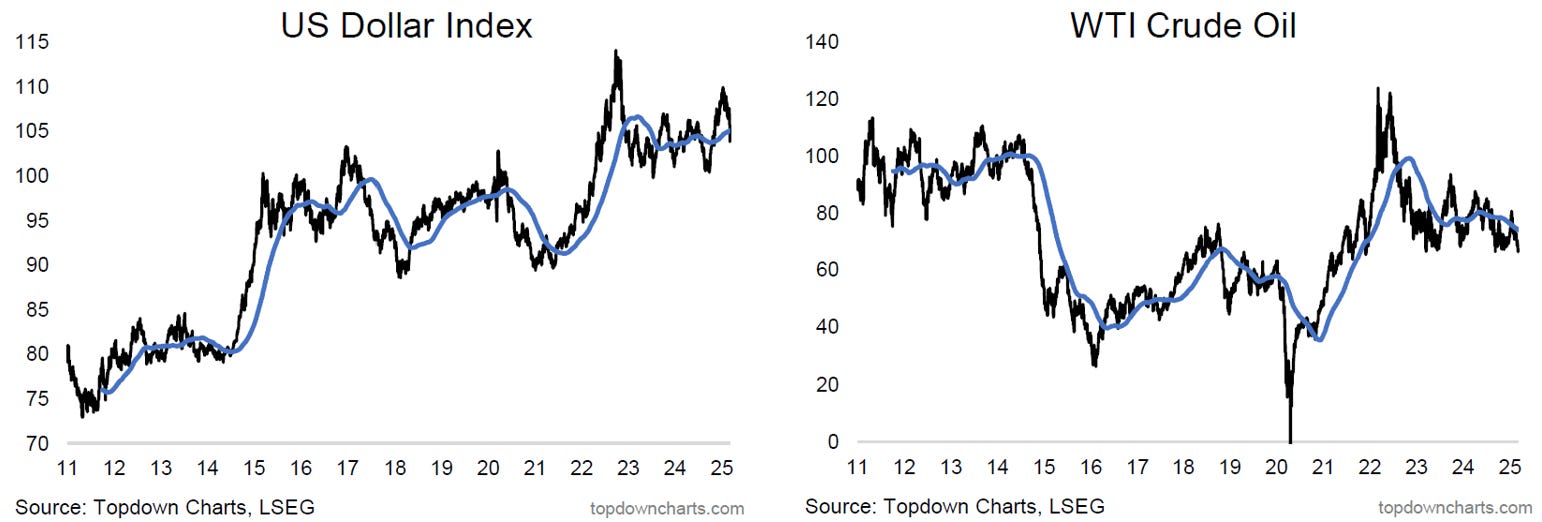
The US dollar index broke down significantly last week; breaching a key support level and confirming the previous breakout failed (echoing the 2022 episode) -- the facetious prognosis is that USD is facing EM levels of policy uncertainty and macro risk. Commodities were mixed-to-weaker; crude oil testing its lower support level, gold muted, agri weaker, industrial mixed.
Market themes: Tech check...
-US Tech stock technicals have taken a turn for the worse
-It follows extremes in sentiment/flows/valuations
-There's always a risk that emerging weakness like this can turn into a larger unwind given how one-sided and stretched things had become.
--warrants a cautious stance on US (tech) stocks, and may reinforce USD weakness and US-to-Global equity rotation
Tech stocks have broken below a couple of key supports, with breadth and intermediate trend significantly deteriorating. Likewise, US tech stocks in particular have pulled back significantly from the relative highs vs global tech stocks.
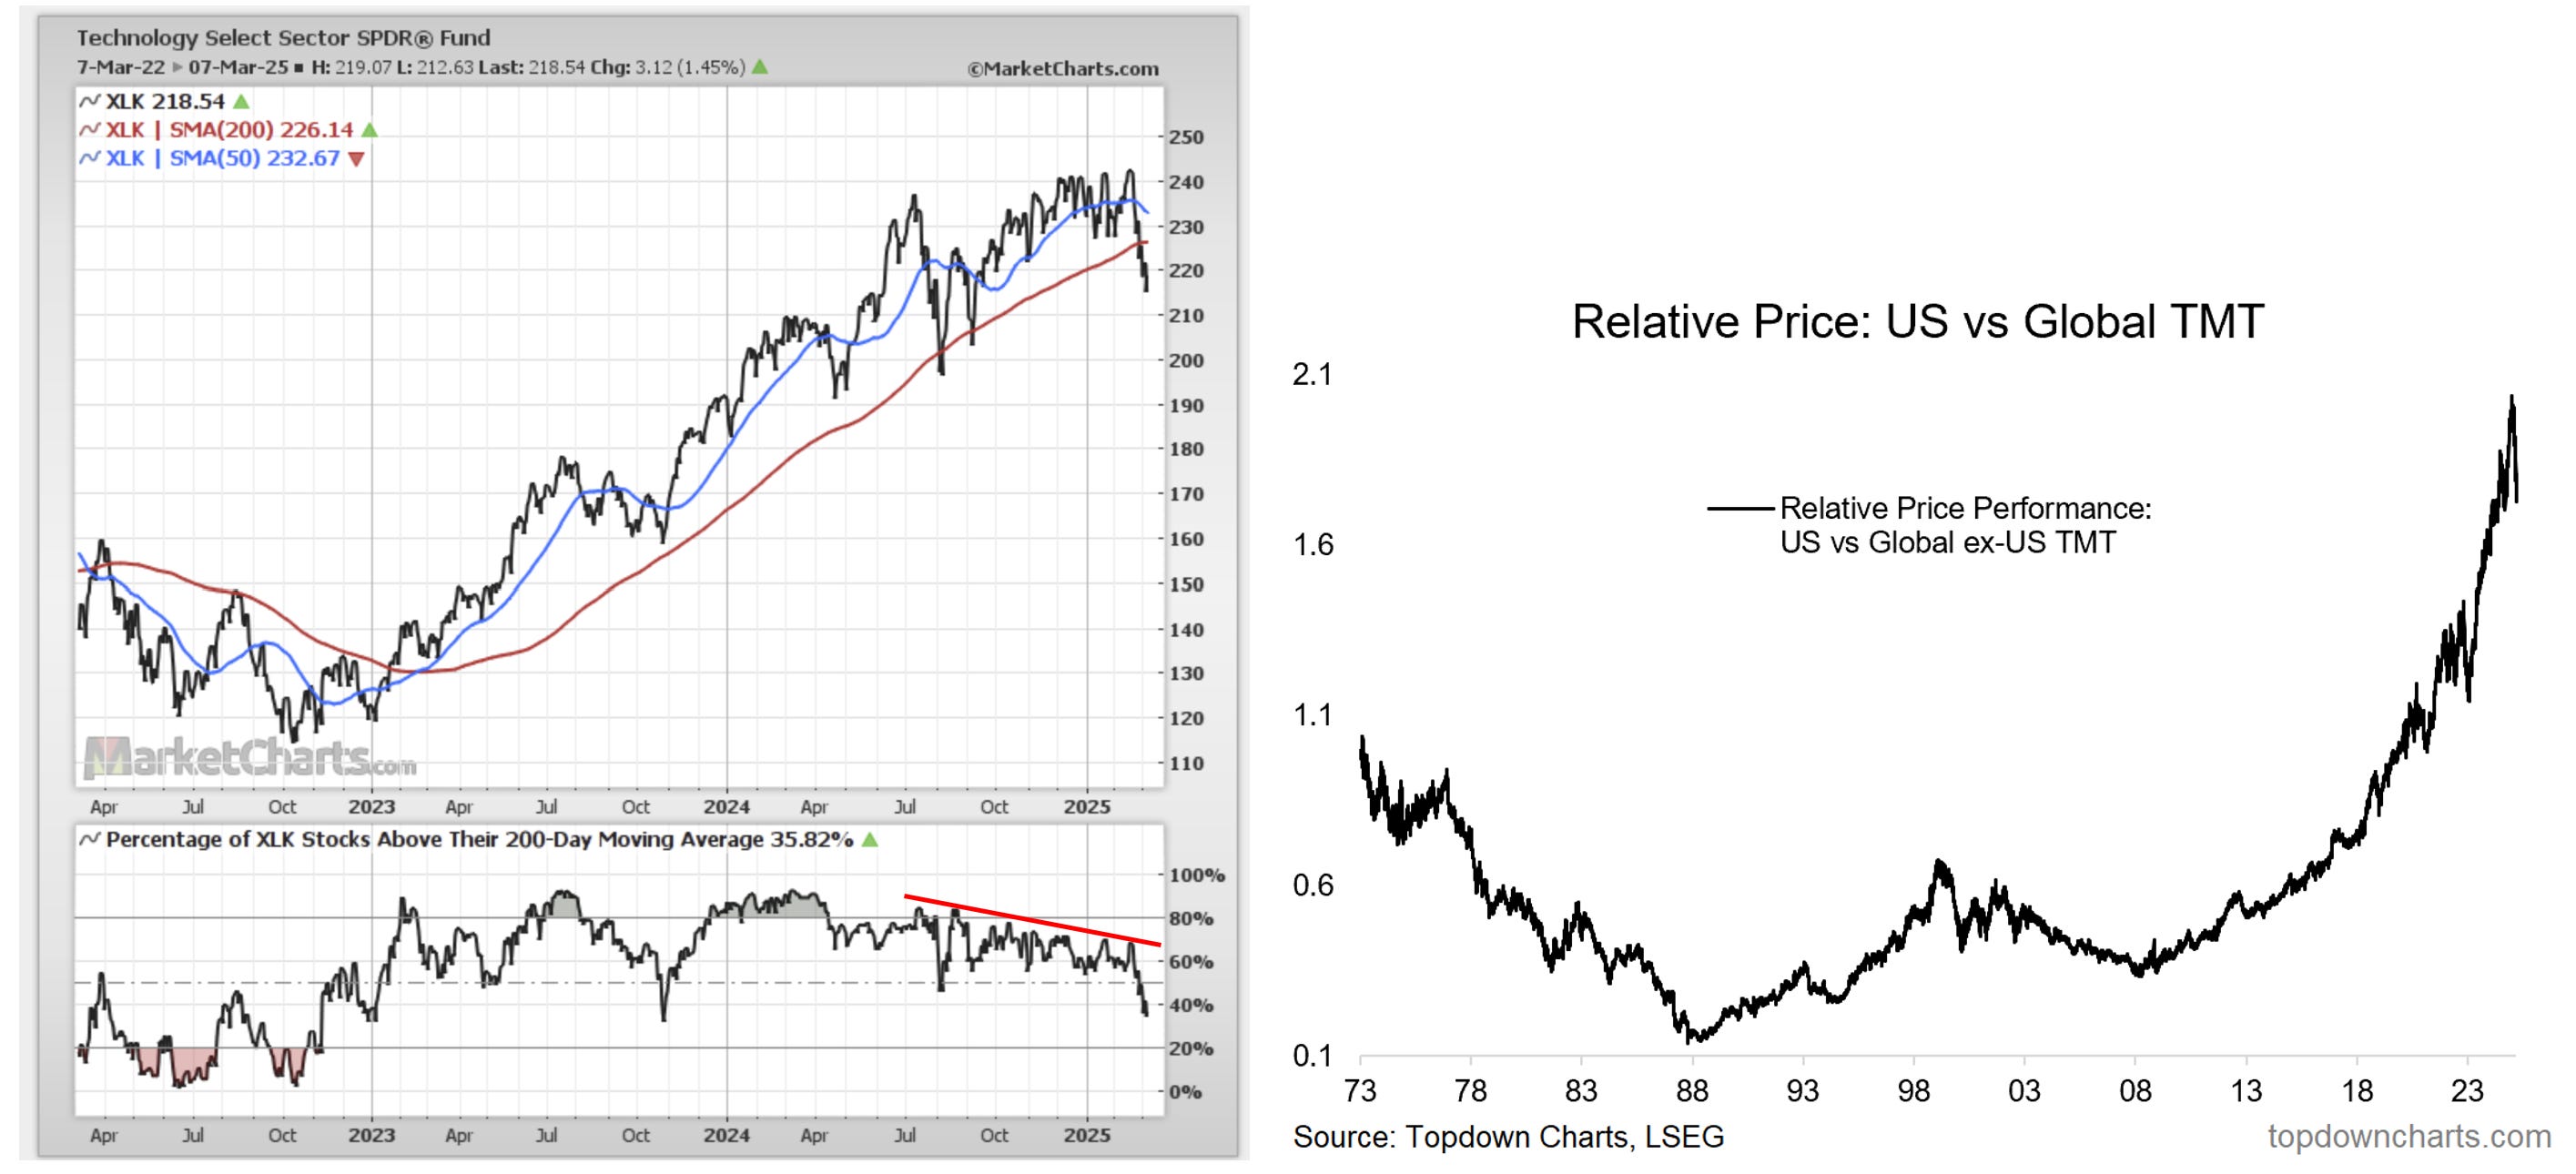
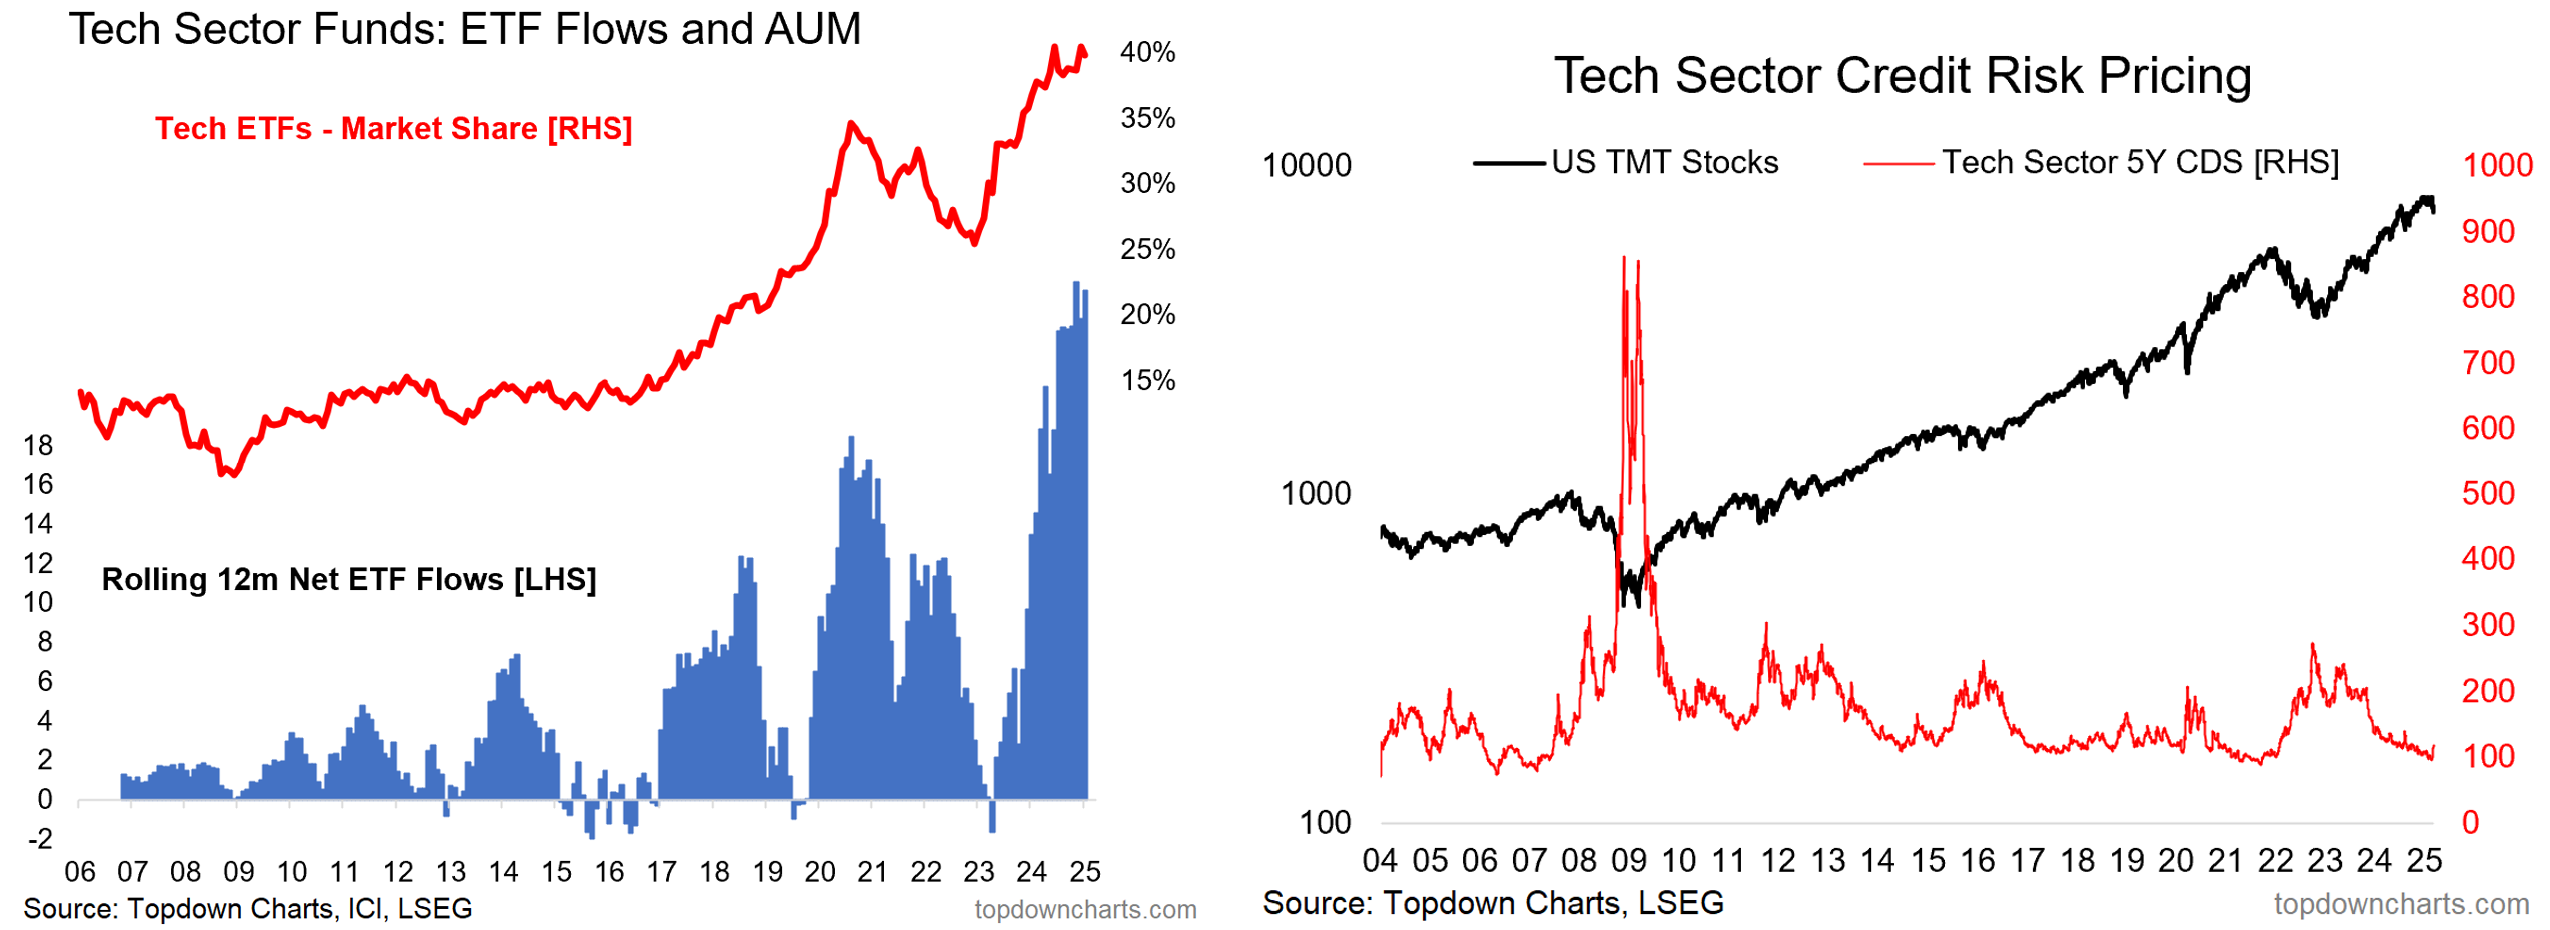
This follows a period of frenzied flows into tech funds and record high allocations by investors to the sector. It also comes as tech sector CDS pricing had reached complacent levels (but now turning up).
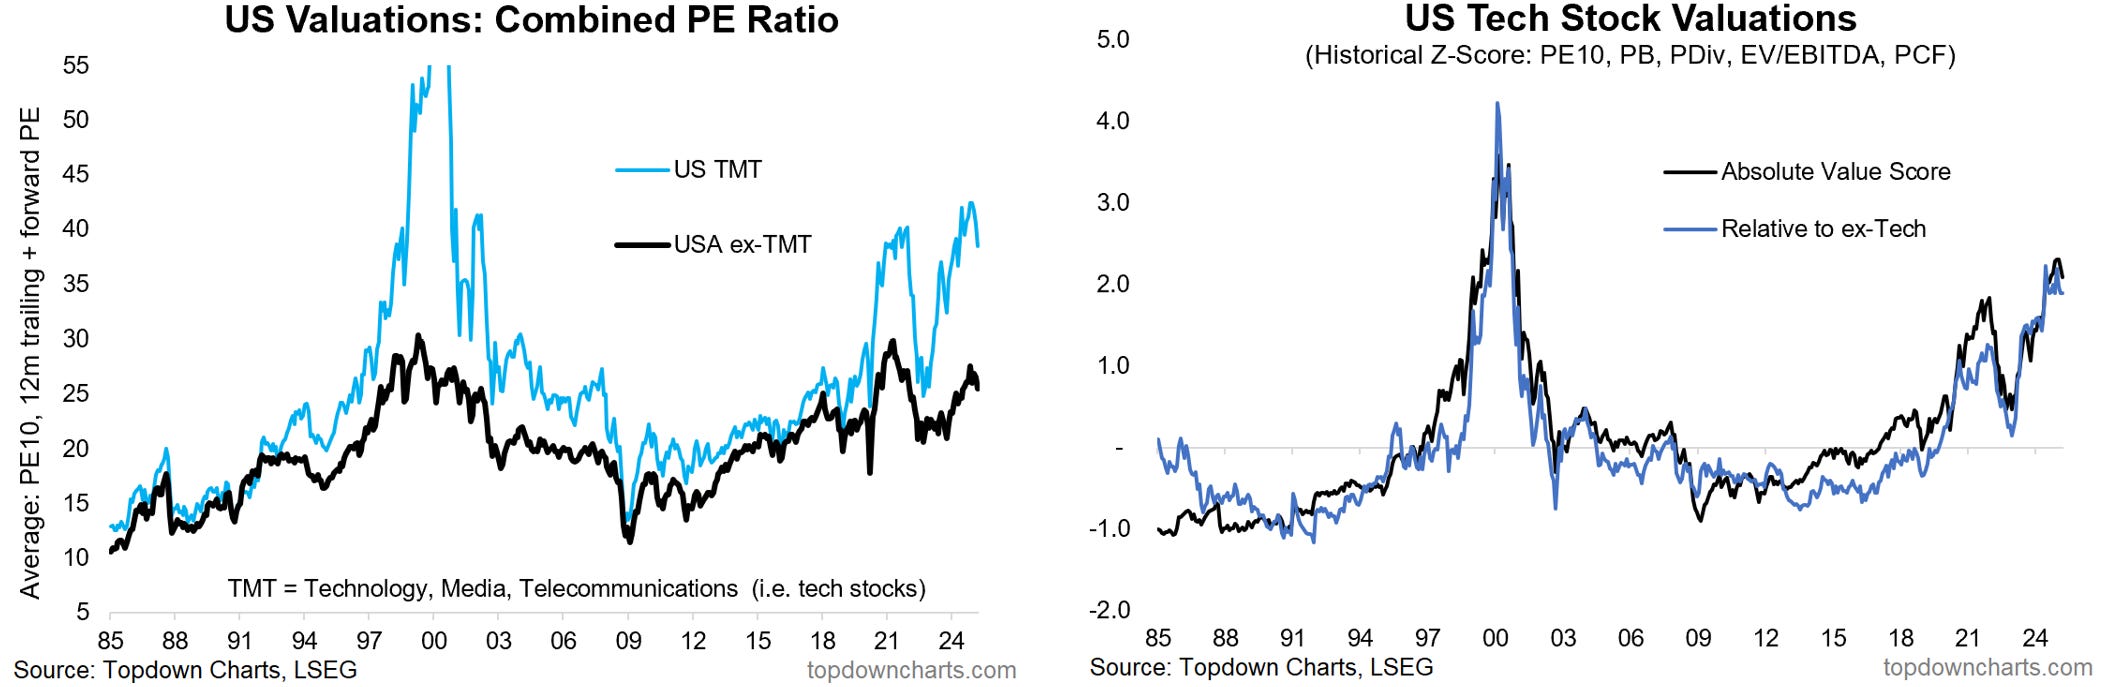
The reason this is concerning is that its set against a backdrop of extreme expensive valuations, and the risk is that it unwinds in a disorderly fashion. Valuation mean reversion has a habit of being something that moves very quickly once it gets started. This can then also trigger a reversal of the virtuous cycle or feedback loops that saw tech stocks riding so high in the first place (confidence, flows, performance chasing, cap-weighted strategies, global flows).
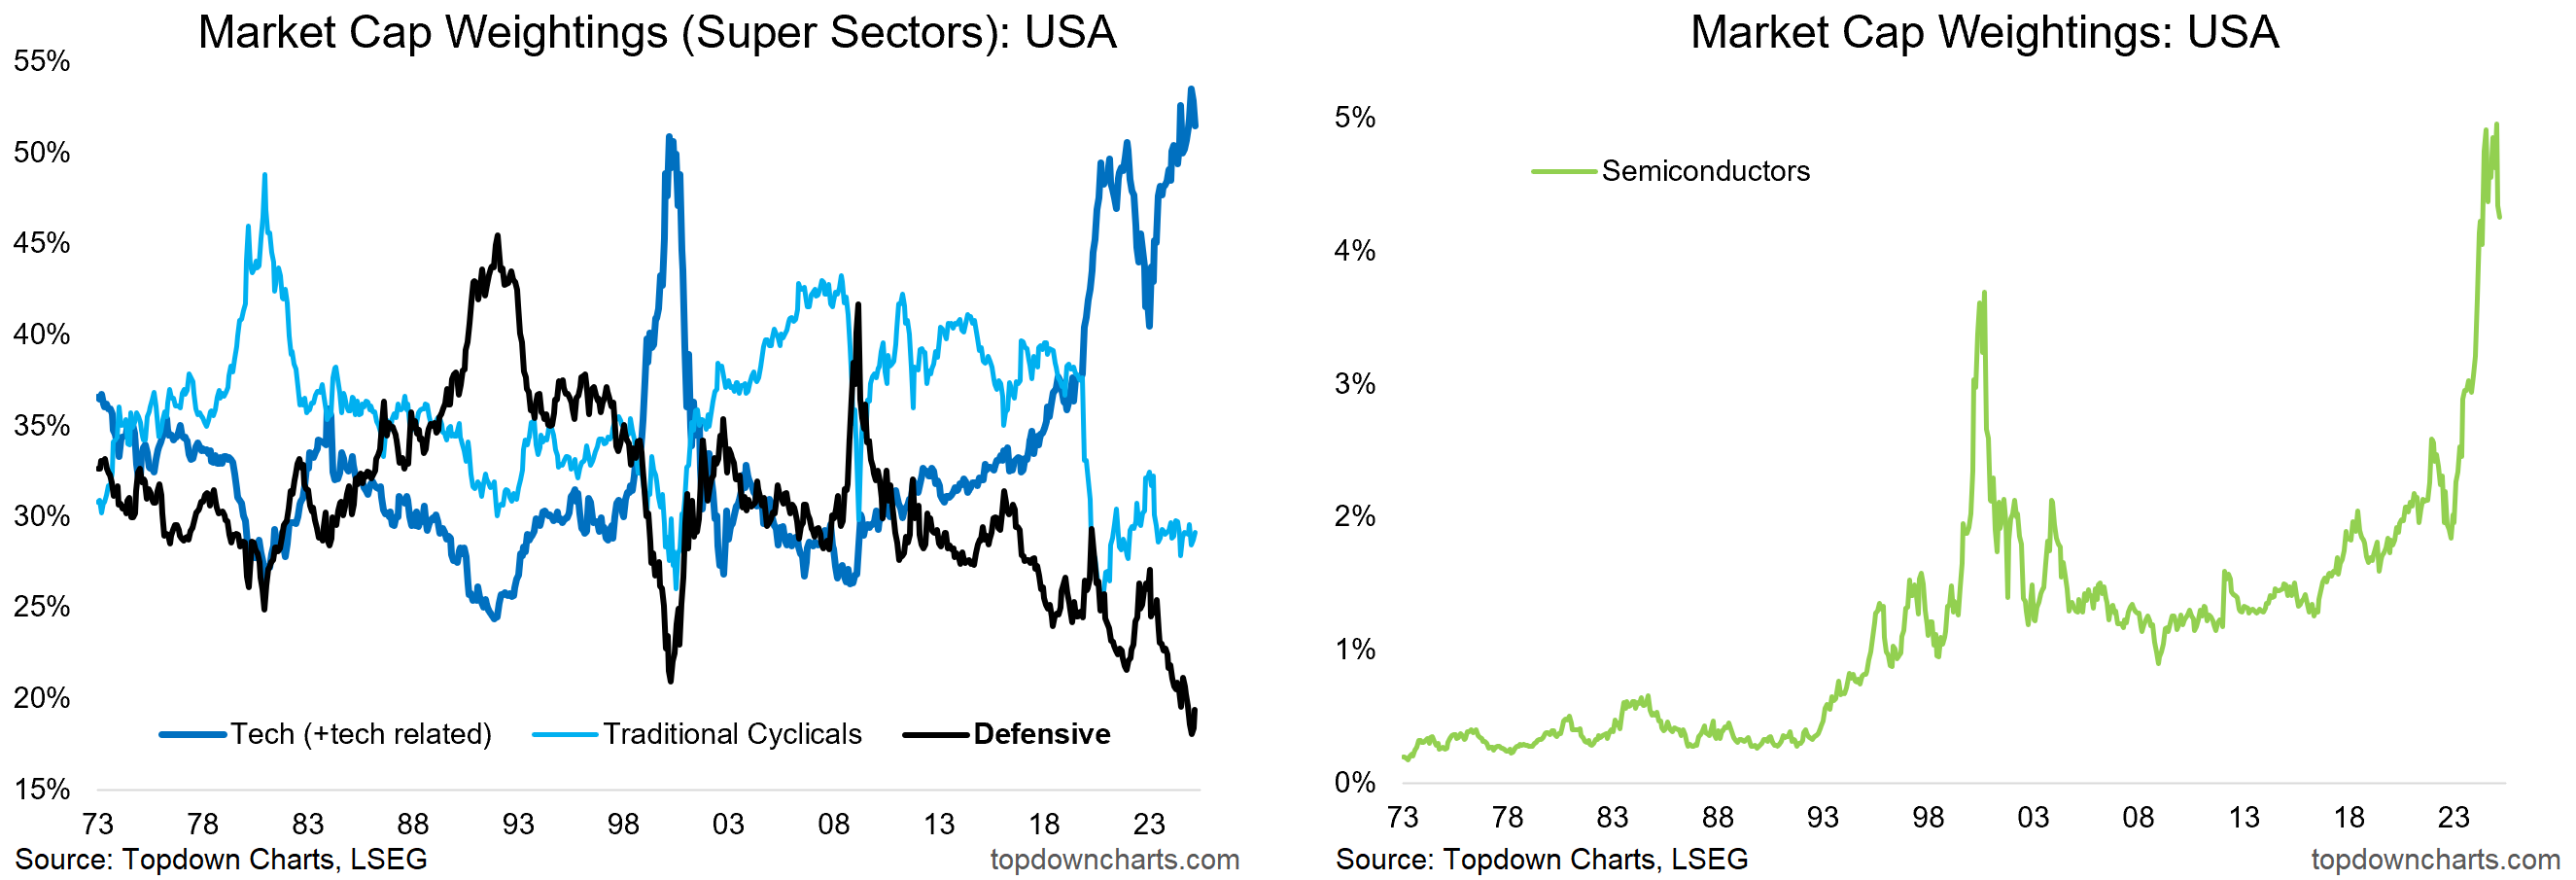
Another angle on that is the record high reached in market cap weighting to tech and tech related sectors, and in particular the semiconductor AI hype driven bubble.
The way the technicals are turning, flows peaking out at frenzied levels, and the pullback in these indicators, makes it look like the peak is in... and that is a very real risk at this point.
Macro & Markets: This week there’s US NFIB, CPI/PPI data, and UoM consumer sentiment (all of which have key info on inflation and inflation expectations). Elsewhere, there’s China money/loans data, and Canada rates decision.
In markets, 10yr yields are rebounding off the lows, DXY breaking down, WTI crude rebounding off lower support levels, gold notching up a lower high, and stocks rebounding from 200dma test...
Research Agenda: I’ll be having minor surgery later this week so will probably take a couple of days off, and back into action the following week, but will certainly be keeping an eye on things macro/markets from the sidelines.
And, in case you missed it -- the February monthly pack was sent out last week.

Best regards,
Callum Thomas
Head of Research | Topdown Charts Limited | www.topdowncharts.com
Mobile: (+64) 22 378 1552
Email: callum.thomas@topdowncharts.com